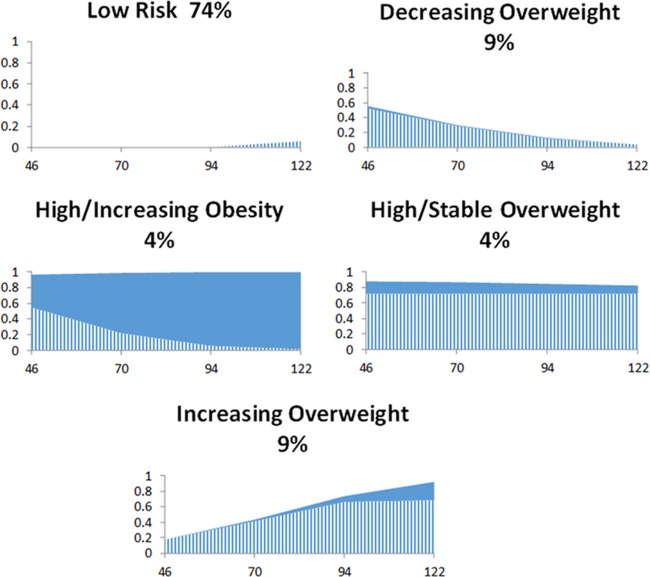
Fig. 1. Trajectories of overweight and obesity among boys, N = 2085.
Percentage figures indicate each trajectory’s share of the boys’ growth mixture model sample. For each trajectory graph, the x-axis shows age in months, and the y-axis probability of overweight (striped area) or obesity (solid area).

