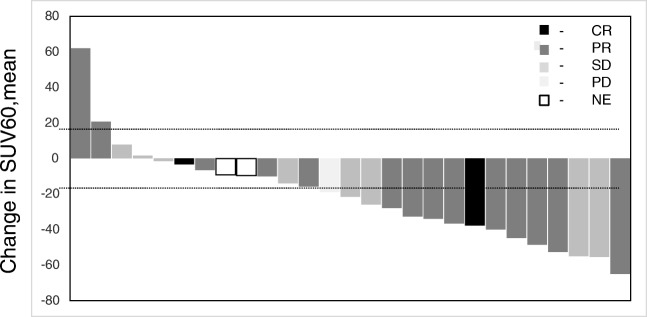
Fig. 2.
Waterfall plot illustrating the change in SUV60,mean with CT response individual lesions following treatment with pazopanib. Dotted line indicates 18% variation in SUV60,mean illustrating the change required to be of clinical significance. CR, complete response; PR, partial response; SD, stable disease; PD, progressive disease; NE, not evaluable

