
Fig. 3.
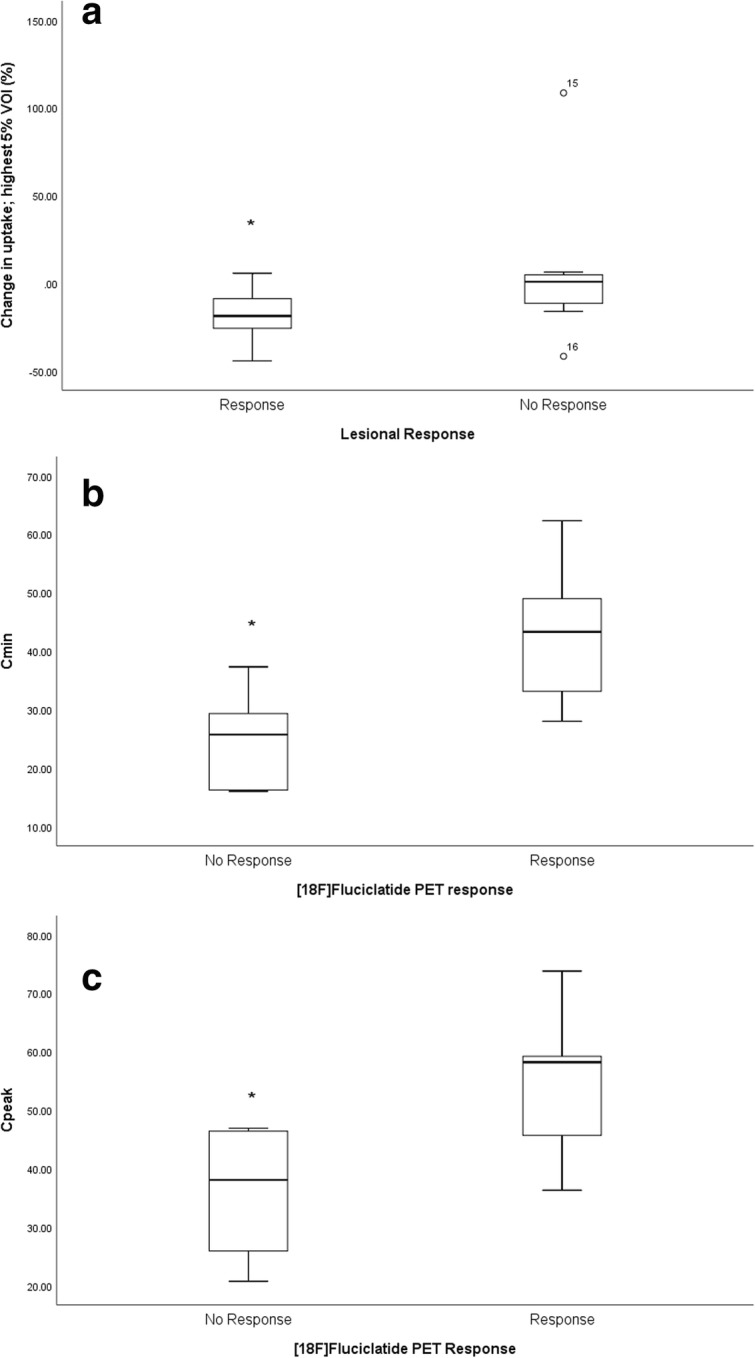
Box plot illustrating a significant relationship between lesional response and change in uptake in highest 5% voxel uptake; *p < 0.05 (a). Box plot illustrating a significant relationship between [18F]fluciclatide-PET response and Cmin; *p < 0.05 (b). Box plot illustrating a significant relationship between [18F]fluciclatide-PET response and Cpeak; *p < 0.05 (c)