Figure 3.
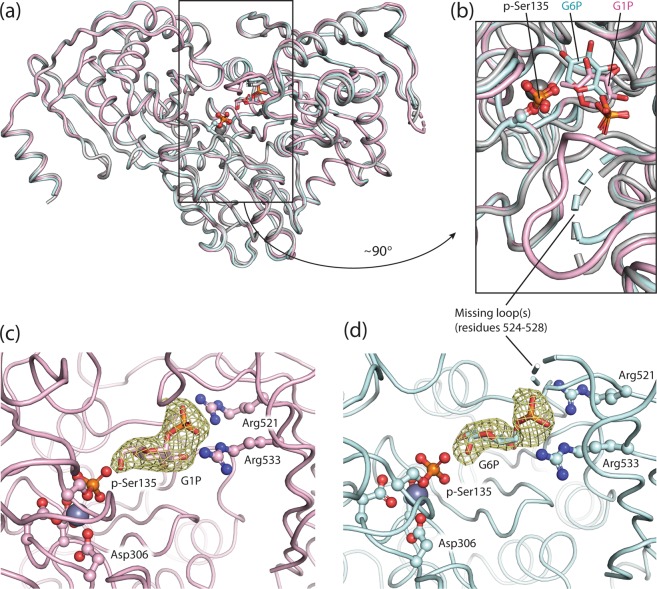
Comparison of free PGM1-2 and substrate and product complexes. (a) Structural alignment of PGM1-2 with no bound ligand (grey) and the complexes PGM1-2:G1P (pale pink) and PGM1-2:G6P (light cyan), rendered as a Cα trace, shows that ligand binding does not affect overall structure. Ligands are shown in sticks representation, phosphoserine (p-Ser135) as ball-and-sticks, and the active site divalent cation as a sphere (grey). (b) Active site region magnified, with coloring and rendering as in panel (a) (rotated roughly 90° out of the plane). (c) Polder OMIT map for G1P in the PGM1-2:G1P complex contoured at 4.0σ strongly supports the presence of the ligand (sticks rendering) in the crystal structure. Selected active site residues, p-Ser135, phosphate-binding Arg521 and Arg533, as well as Asp306, Asp308, and Asp310 complexing the divalent cation (grey sphere), are shown as ball-and-sticks. (d) Polder OMIT map for G6P in the PGM1-2:G6P complex contoured at 3.5σ.

