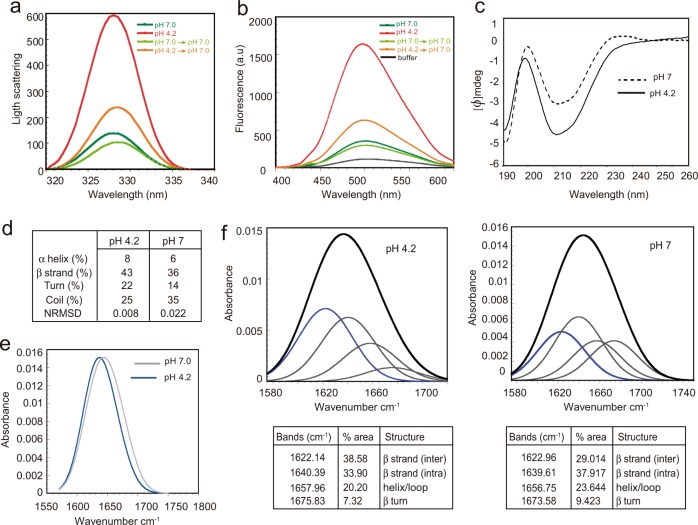
Fig. 4. Amyloid features of rEsp_N.
a Synchronous light scattering of 0.1 mg/ml rEsp_N samples in phosphate–citrate buffer either at pH 7.0, 4.2, and pH-reverted samples to pH 7.0. b Bis-ANS fluorescence of 0.1 mg/ml rEsp_N at pH 7.0, pH 4.2, and pH-reverted samples to pH 7.0. Free bis-ANS is represented in black. c Far-UV CD spectra of 0.05 mg/ml rEsp_N at pH 7 and pH 4.2. d Secondary structure composition of rEsp aggregates. Data were analyzed with Dichroweb implementing the CDSSTR algorithm. e FTIR spectra in the amide I region of rEsp_N aggregates formed after 24 h in acidic buffer (blue line) and rEsp_N in its soluble state (black line). f Deconvolution of the FTIR spectra of the rEsp_N at pH 4.2 and at pH 7. Component bands after gaussian deconvolution are shown. Percentage of each secondary structure is detailed in the tables.

