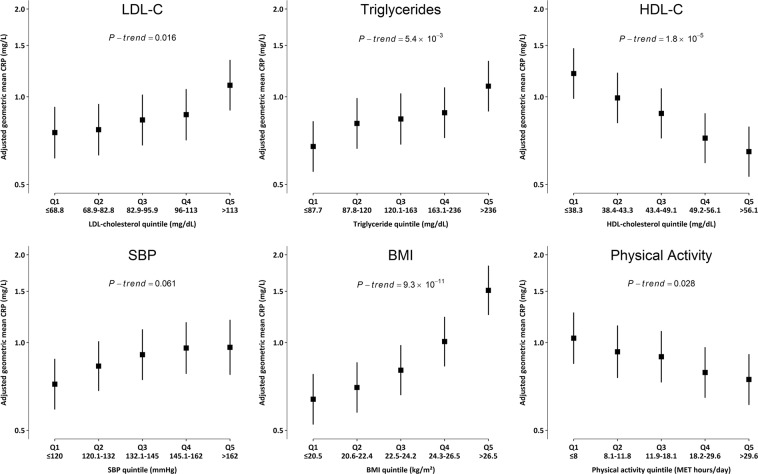
Figure 1.
Cross-sectional associations of high-sensitivity C-reactive protein (CRP) with selected cardiovascular disease (CVD) risk factors. Analyses were carried out only in controls (n = 5,285). Cut-offs for biomarker quintiles were based on their distribution in controls only. Geometric mean of CRP was adjusted for age, age2, sex and region. P-trend was calculated using chi-square test statistic with 1 degree of freedom. Error bars represent 95% CI for each quintile.

