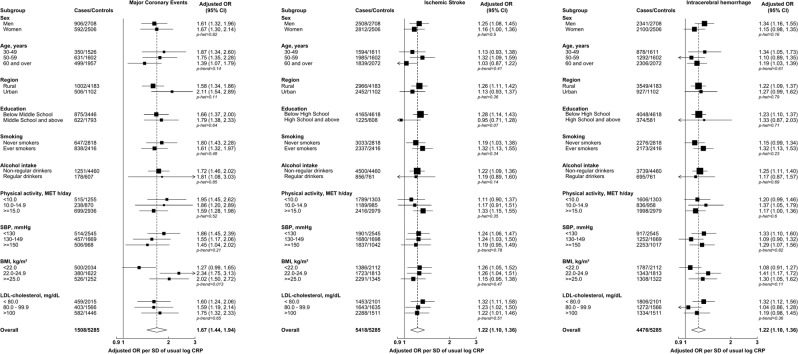
Figure 4.
Risk of Major Coronary Events, Ischemic Stroke, and Intracerebral hemorrhage per standard deviation (SD) of usual log-transformed high-sensitivity C-reactive protein (CRP) by pre-specified subgroups. Models were adjusted (where appropriate) for age, age2 and sex (base model) and additionally for income, occupation, education, SBP, BMI, diabetes, physical activity, standing height, smoking, alcohol, LDL-C and TG. The models were fitted separately for each of the 10 study areas in each subgroup strata and estimates were meta-analyzed; in each subgroup strata, study areas were excluded when models failed to converge (62 models out of 750 models). Error bars represent 95% confidence intervals (CI). The sizes of the boxes are proportional to the inverse of the variance of the log ORs. The dotted line represents the overall adjusted OR. The open diamond represents the overall adjusted OR and its 95% CI. MET: metabolic equivalent of task; p-het: p-value for heterogeneity; p-trend: p-value for trend.

