Figure 3.

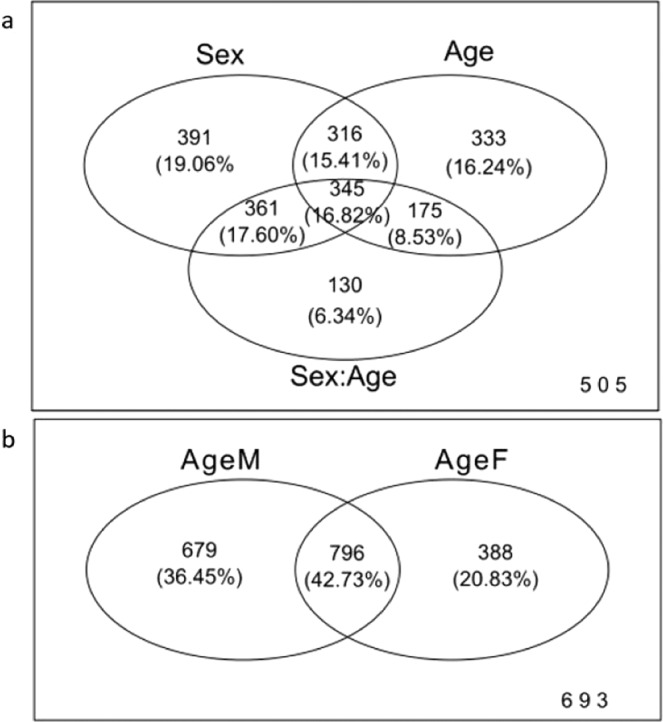
The Venn diagram represents an overview of the number of lipids with significant change in their relative intensity between categories of sex, age and sex:age interaction, and ageing in males and females in D. magna. (a) The number of annotated lipids found to have a statistically-significant change in relative intensity (adjusted p-value <0.001) across the factors sex, age, and sex:age interaction are represented by numbers and the respective percentage within each grouping. The 505 lipids outside of the groupings do not show significantly (adjusted p-value <0.001) changing relative intensities in any of the conditions presented. (b) The number of lipids identified as showing a significant change in relative intensity (adjusted p-value <0.001) observed within the conditions of ageF (female ageing data only) and ageM (male ageing data only) are represented by numbers and percentages within each grouping.
