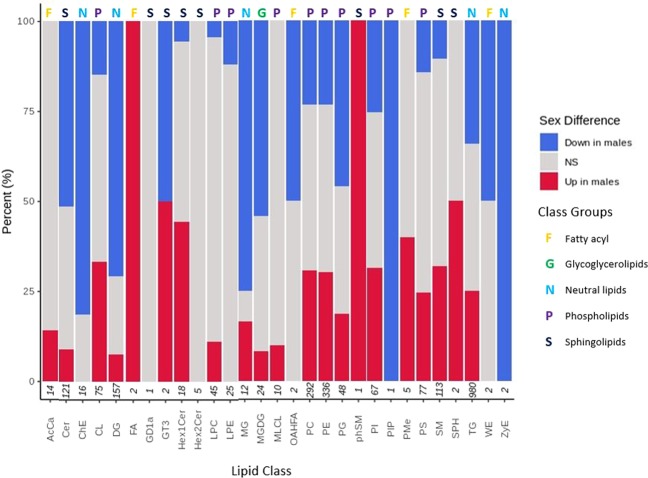
Figure 4.
Differences in lipid class between male and female D. magna. Stacked normalised bar chart shows percentage of lipid classes with statistically-significant changes between sexes. Lipids lower in males are shown in blue whilst lipids higher in males are shown in red. Grey represents no significant difference between sexes (adjusted p-value <0.001). For female age groups 20, 40 and 80 days eight technical replicates were used and for intermediate age groups two technical replicates were used. For male D. magna age groups 10, 20 and 40 days eight technical replicates were used and for intermediate age groups two technical replicates were used. For detailed information regarding biological replicate numbers see Supplementary Tables S1 and S2. Numbers on the x-axis represent the total number of lipids identified in each class. Numbers on the x-axis represent the total number of lipids identified in each class, for lipid class abbreviation descriptions and classification see Supplementary Table S7.

