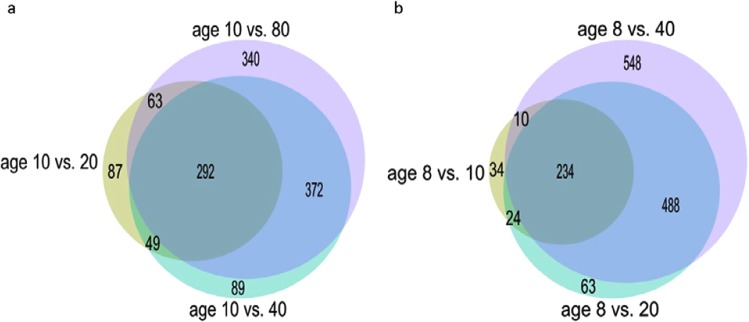
Figure 5.
Venn diagram of lipids statistically-significantly changing lipid intensity with age between increment age groups compared to youngest age group for each gender. (a) Comparison of lipids in female D. magna showing statistically-significant changes in lipid intensity (p-adjusted <0.001) from age groups 20, 40 and 80 days compared to youngest female group aged 10 days shows larger difference with increased age (e.g. between 10 and 20 days only 87 unique lipids identified showing similarity between age groups compared to 340 unique lipids between aged 10 days and 80 days). The size of the circle is proportionally relative to number of lipids. (b) Comparison of significant lipids in male D. magna (p-adjusted <0.001) from age groups 10, 20 and 40 days compared to youngest male group aged 8 days shows larger difference with increased age (e.g. between 8 and 10 days only 34 unique lipids identified showing similarity between age groups compared to 548 unique lipids between aged 8 days and 40 days).

