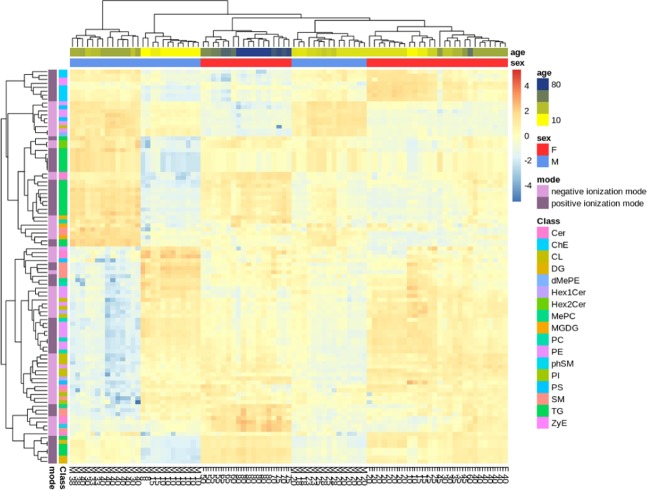
Figure 8.
Heatmap of lipid changes with sex:age interaction. Heatmap of lipidomics analysis for top 50 lipids significantly-changing concentrations in positive ion mode (dark purple) and top 50 lipids significantly changing levels in negative ion mode (light purple, adjusted p-value <0.001) in D. magna. The heat map shows 100 selected lipids indicated by class colours (rows) and 29 samples (columns). Colours correspond to per-lipid z-score that is computed from area under the curve. Lipids and samples were hierarchically clustered based on Euclidean cluster extraction and average linkage. Numbers on the x-axis represent the total number of lipids identified in each class, for lipid class abbreviation descriptions and classification see Supplementary Table S7.

