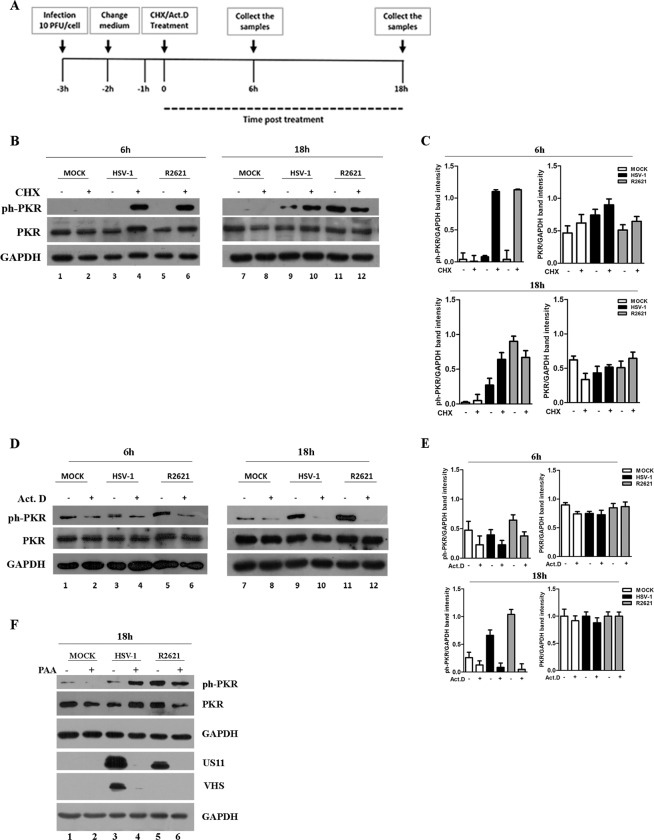
Figure 2.
Detection of phosphorylated PKR and total PKR during viral replication in cells treated with protein, mRNA and viral DNA synthesis inhibitors. (a) Graphical representation of the experiment. (b–d) HEp-2 cells were mock infected and infected with HSV-1 (F) and R2621 viruses. Three hours p.i., the cells were left untreated or treated with Cycloheximide (CHX) (50 μg/ml) or actinomycin D (Act.D) (10 μg/ml), separately, and collected at 6 h and 18 h of treatment. Western blot analysis was performed to evaluate ph-PKR, PKR and GAPDH expression. The grouping blots are cropped from two different gels, as displayed in the figure with the white space. (c–e) Band density was determined with the T.I.N.A. program, expressed as fold change over the appropriate housekeeping genes and graphically represented by GraphPad Prism 6 software. (f) HEp-2 cells were mock infected or infected with HSV-1 and R2621 viruses at MOI 10, and collected at 24 h p.i. PAA was used at 300 μg/mL into the inoculum, and maintained in the medium.

