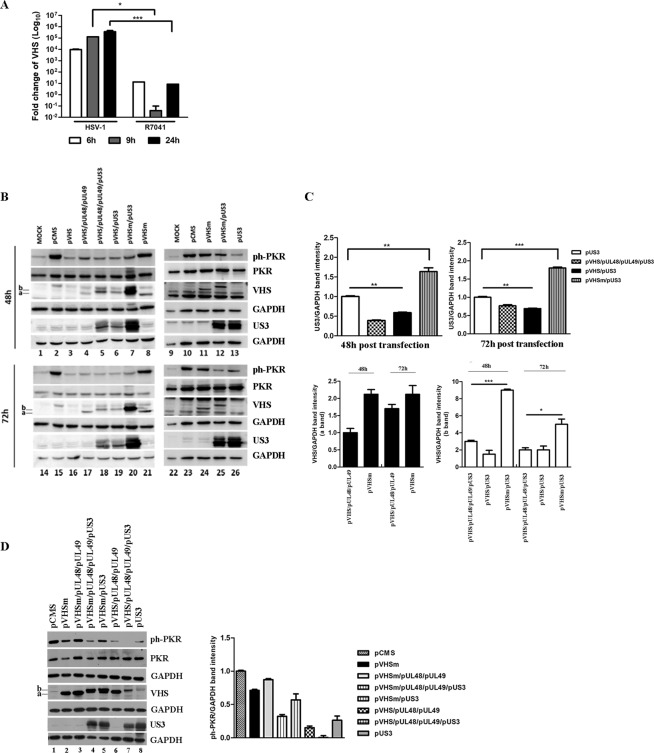
Figure 5.
Analysis of VHS and Us3 proteins. (a) HEp-2 cells were infected with HSV-1 and R7041 viruses at MOI 10, collected at different time points (6 h, 9 h, and 24 h) and subjected to Quantitative Real-Time PCR was performed to detect VHS transcripts. (b) 293T cells were transfected with a combination of plasmids encoding VHS, VHSm, UL48, UL49, and Us3 viral proteins. The pCMS-EGFP plasmid was used as a control vector. The cells were harvested at 48 h and 72 h and the expression of ph-PKR, PKR, VHS and Us3 proteins was evaluated by western blot analysis. The (a,b) indicate the lower and the higher VHS protein bands, respectively. The grouping blots are cropped from different gels as displayed in figure with white spaces and were captured using a ChemiDoc Touch Imaging System (Bio-Rad). The expression of each protein was simultaneously measured at 48 h and 72 h. (c) Band density of Us3 and VHS (a and b bands) was determined with the T.I.N.A. program, expressed as fold change over the appropriate housekeeping genes and graphically represented with GraphPad Prism 6 software. Statistical significance was tested using one-way ANOVA (***p < 0.001,*p < 0.05). (d) 293T cells were transfected with a combination of plasmids encoding for VHSm, UL48, UL49, and Us3 viral proteins. The pCMS-EGFP plasmid was used as a control vector. The cells were harvested at 48 h and the expression of ph-PKR, PKR, VHS and US3 proteins was evaluated by western blot analysis. The band intensity of ph-PKR and PKR was expressed as fold change over the appropriate housekeeping genes and graphically represented.

