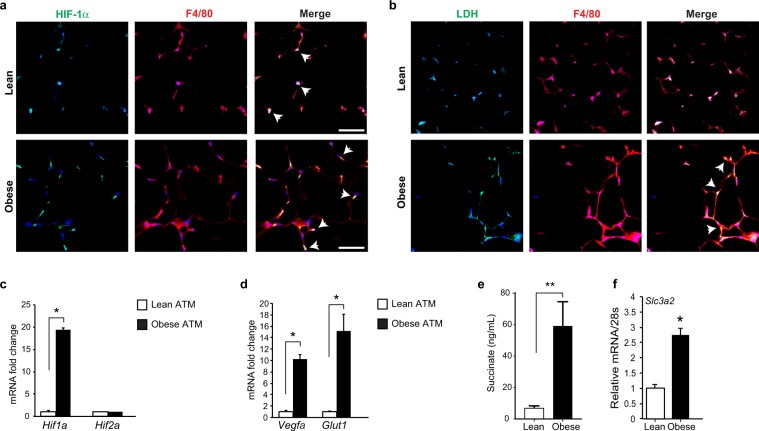
Figure 2.
(a,b) Immunofluorescence staining of (a) HIF-1α (green), the macrophage marker F4/80 (red) and DAPI nuclear stain (blue), and (b) lactate dehydrogenase (LDH, green), F4/80 (red) and DAPI (blue) in WAT of lean and obese mice. Colocalization is shown in the merged image (arrows). Scale bar = 100 µm. (c,d) Relative mRNA expression of (c) Hif1a and Hif2a, and the HIF target genes (d) Vegfa and Glut1 in ATM isolated from lean and obese mice (n = 3). (e) Levels of succinate in ATM of lean and obese mice (n = 6). (f) Relative mRNA levels of the glutamate transporter Slc3a2 in ATM from lean and obese (n = 3). Data is expressed as mean ± s.e.m. *p < 0.05.

