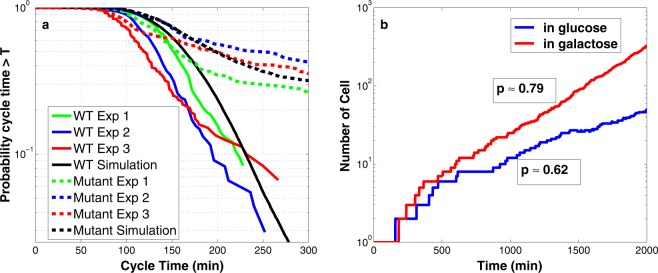
Fig. 4. Stochastic phenotypes of two more mutant strains.
a Comparison of wild-type and mutant cells growing in raffinose. The probability that a cell divides with a cycle time longer than a specific time is plotted for wild-type cells (solid lines) and mutant cells (dotted lines). The black lines are generated by our hybrid stochastic model and the red-blue-green lines are the results of three independent experimental runs by Ball et al.21. To model growth on raffinose medium in our simulation, the specific growth rate of cells is set to 0.00433 (MDT = 160 min). b Comparison of cell proliferation for colonies of cells growing in glucose (blue) or galactose (red). The probability of division in our computational culture is given in the boxes next to each simulation. To mimic growth in glucose and galactose media, respectively, the specific growth rates are set to 0.0072 and 0.004621 , i.e., MDT = 96 and 150 min, respectively.

