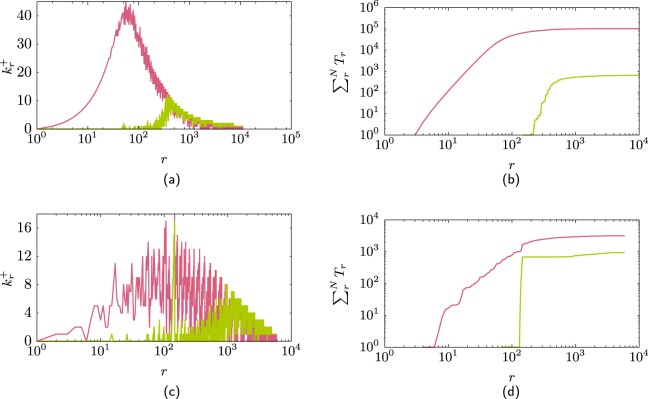
Figure 4.
(a) Difference in the hub connectivity for two networks that have the same degree distribution as the AS-Internet. One network has maximal connectivity within the nodes (pink line) (ρ = −0.181) and the other minimal connectivity within the hub nodes (green line) (ρ = −0.20). (b) This change of connectivity is reflected in the number of triangles in each network, where the network with maximal hub connectivity (pink line) has almost two orders of magnitude more triangles that the other network (green line). (c,d) Similar as (a,b) but for the Hep–Th network where assortativity coefficients ρ = 0.69 and ρ = −0.42.

