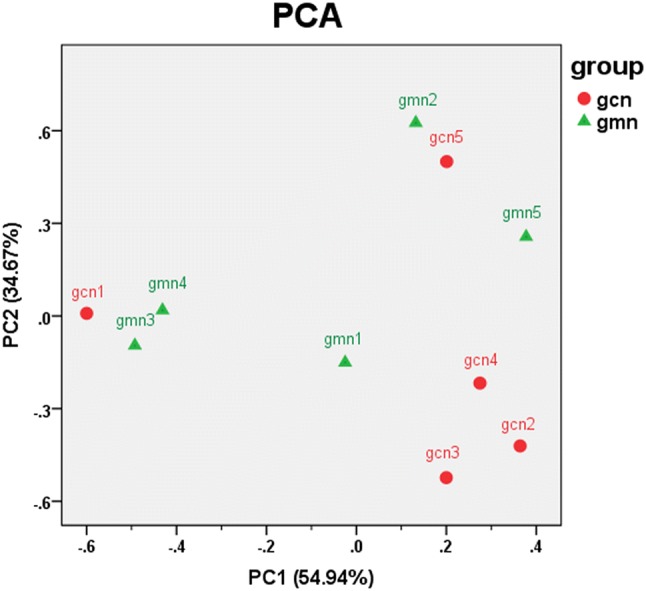
Fig. 4.

Effects of Folium senna decoction gavage combined with restraint and tail pinch stress on intestinal microbiota structure. Principal components analysis (PCA) shows the natural distribution of samples. The percentages in brackets on the axes represent the different proportions of raw data explained by the corresponding principal components. Each point represents a sample. The closer the points are, the more similar the structures of the communities. gcn control group, gmn model group
