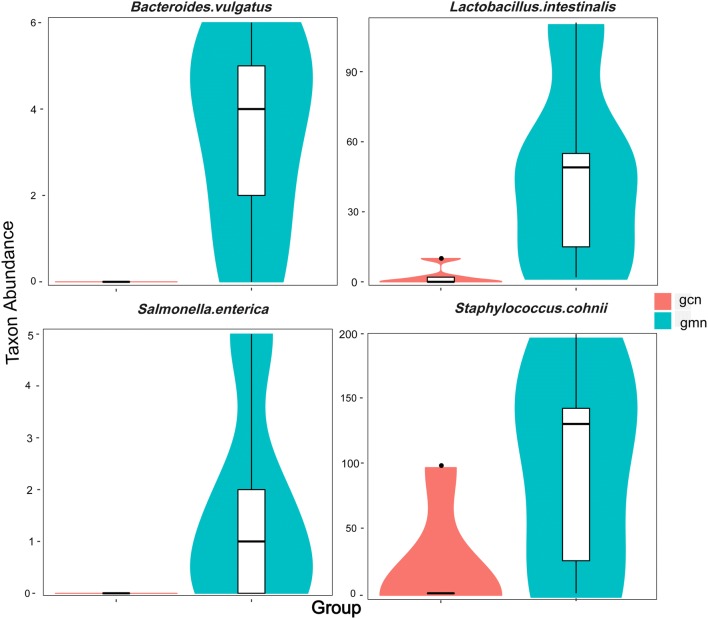
Fig. 6.
Abundance distribution between groups at the species level. The abscissa represents the groups, and the ordinate represents taxon abundance in each group. Based on the Metastats significant difference analysis results, the taxa that had significant differences were identified. gcn control group, gmn model group

