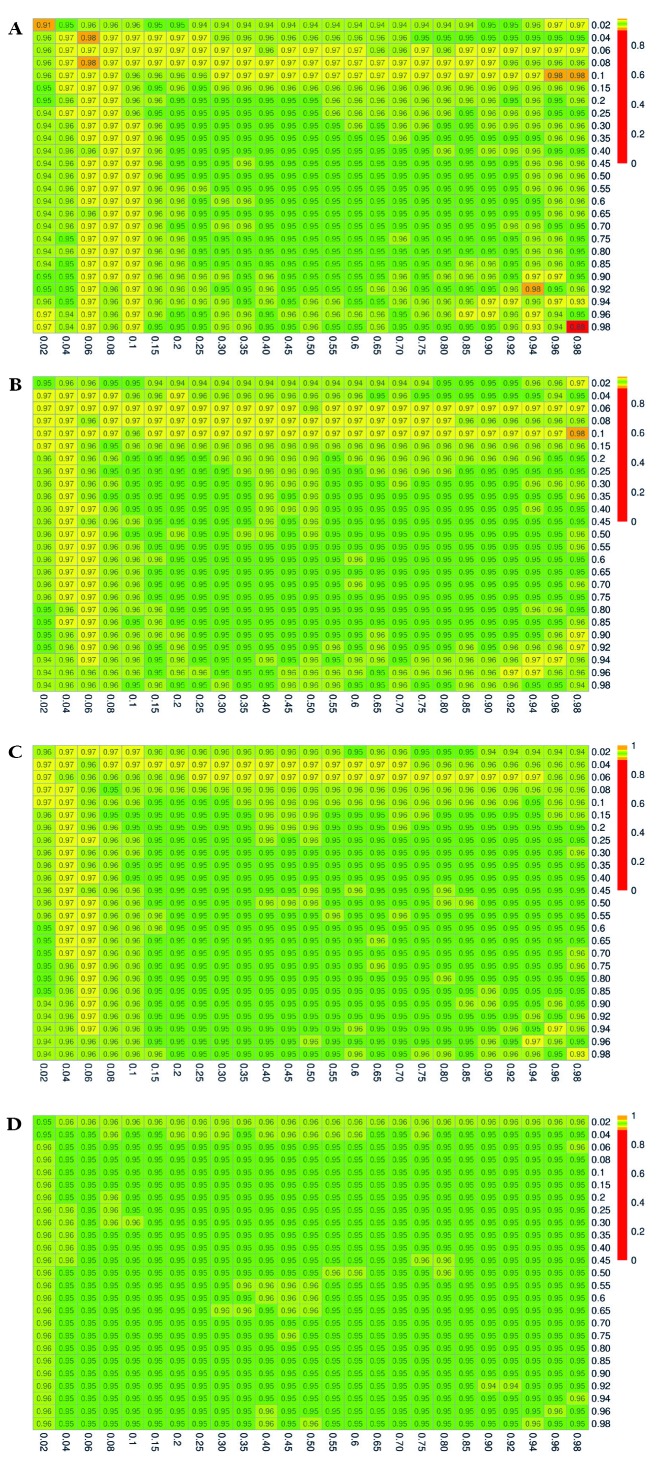
Figure 3.
Estimated 95% coverage probabilities for the confidence intervals constructed using the delta method. Pxrf and Pyrf vary over the range (0.02, 0.98). Panel A. (nxrf, nyrf) = (50, 50). Panel B. (nxrf, nyrf) = (100, 50). Panel C. (nxrf, nyrf) = (100, 100). Panel D. (nxrf, nyrf) = (500, 500).

