
Figure 1. Kaplan-Meier curves for the composite of death/myocardial infarction/unstable angina hospitalization by randomized noninvasive testing modality and diabetes history.
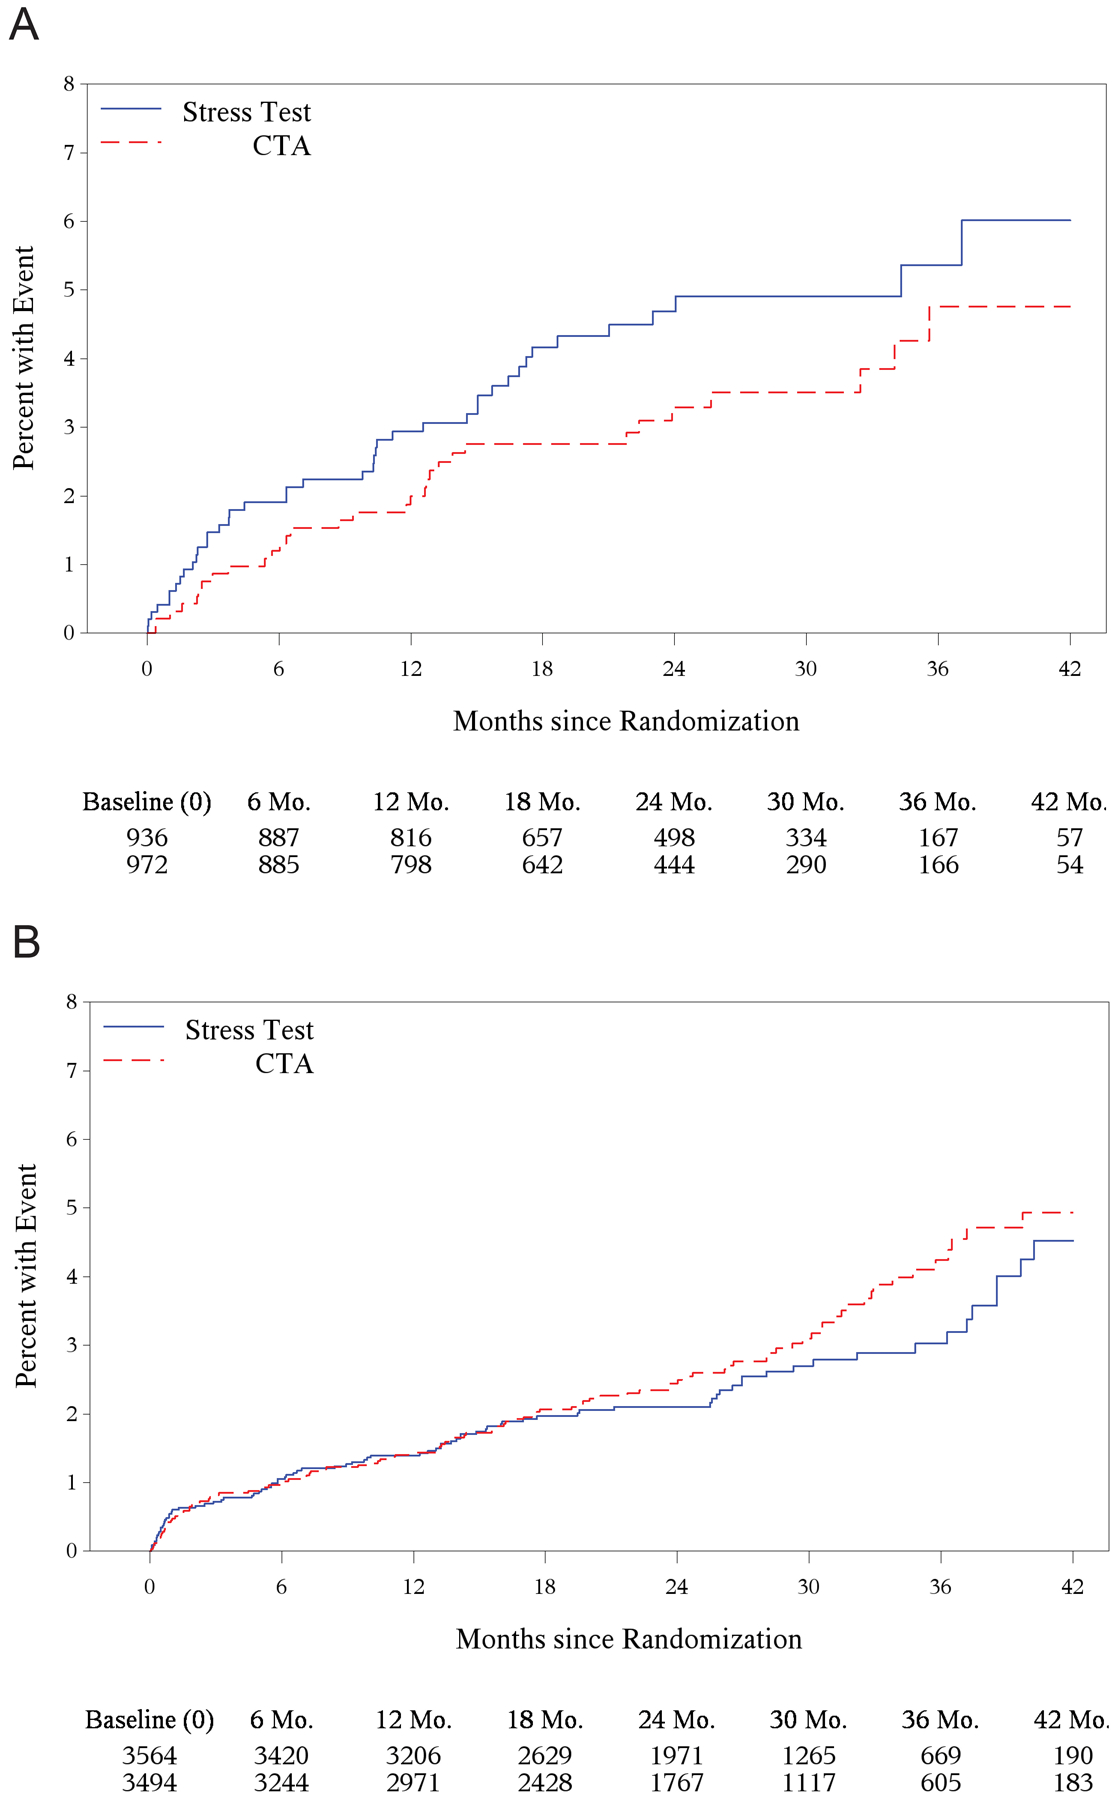
. (A) Patients with diabetes. Adjusted hazard ratio between patients randomized to CTA vs. functional testing, 0.74; 95% confidence interval, 0.47–1.18; p-value = 0.207. (B) Patients without diabetes. Adjusted hazard ratio between patients randomized to CTA vs. functional testing, 1.18; 95% confidence interval, 0.88–1.57; p-value = 0.269. CTA, computed tomographic angiography.