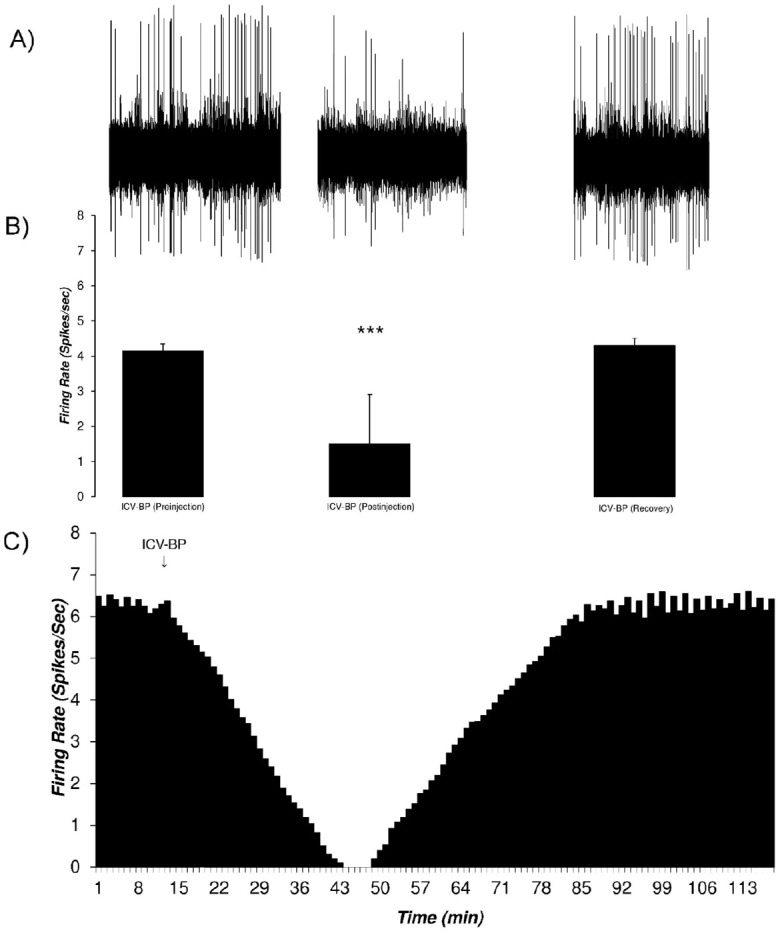
Figure 7.

The response of the VTA dopaminergic neurons to intracerebroventricular application of the bupropion with inhibitory effects.
A. A sample of the multiunit recording shows the recorded trace in three phases of pre-injection, post-injection, and recovery before and after microinjection of bupropion (1 mol, 5 μL/3min, at 11th to 13th min) into the ipsilateral ventricle. The average firing rates of the before and after consecutive minutes for each minute was calculated for determining the statistical difference for each minute of the isolated unit; B. The bar graph of the average firing rate of the VTA dopaminergic neuron in each period. The inhibitory periods with the least firing rate has a statistical difference with pre-injection and recovery periods. Bupropion elicited a profound inhibition in the neuron; C. Continuous histogram of mean firing rate in three mentioned phases. The Mean±SD firing rate of the pre-injection period was 6.3±0.14 spikes/second. The post-injection period was included in a period with inhibition of the neuron that began at 14th to 68th min of the recording. In the inhibition period, the, Mean±SD firing rate decreased to 3±1.94 spikes/second with a minimum of 0 spikes/second firing in the 44th to 48th min of recording. The recovery period was the period that the firing rate returned to its pre-injection period (6.27±0.19 spikes/second). The middle bar graph shows the comparison of the neuronal firing in the pre-injection, inhibition, and recovery periods. The mean firing rate of the inhibition period showed a statistically significant difference. One-way repeated measures ANOVA with the Tukey’s post hoc test were used for statistical evaluation.
The data are presented as Mean±SD with significant level of *** P<0.001; ICV-BP=Intracerebroventricular application of bupropion.
