. 2012 Jul 22;80(5):359–364. doi: 10.1007/s12098-012-0855-0
© Dr. K C Chaudhuri Foundation 2012
This article is made available via the PMC Open Access Subset for unrestricted research re-use and secondary analysis in any form or by any means with acknowledgement of the original source. These permissions are granted for the duration of the World Health Organization (WHO) declaration of COVID-19 as a global pandemic.
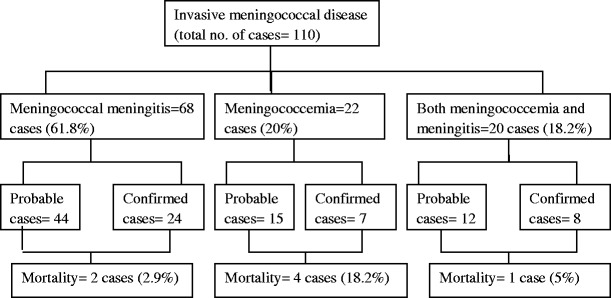
Fig 3.

Study flow chart
