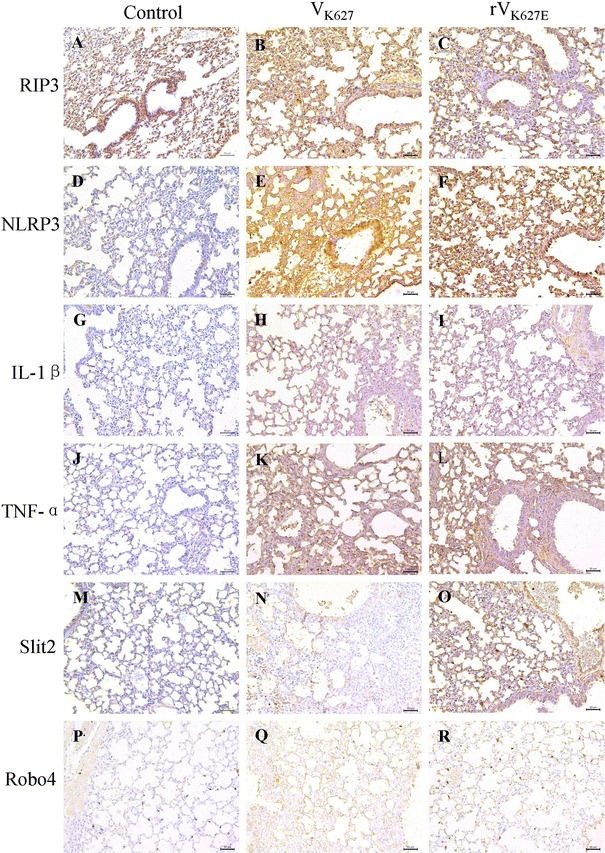
Fig. 4.

Distribution of RIP3 (a–c), NLRP3 (d–f), IL-1β (g–i), TNF-α (j–l), Slit2 (m–o), Robo4 (p–r) in the lung of H7N9 AIV-infected BALB/c mice and the controls at 5 dpi. Scale bar 50 μm

Distribution of RIP3 (a–c), NLRP3 (d–f), IL-1β (g–i), TNF-α (j–l), Slit2 (m–o), Robo4 (p–r) in the lung of H7N9 AIV-infected BALB/c mice and the controls at 5 dpi. Scale bar 50 μm