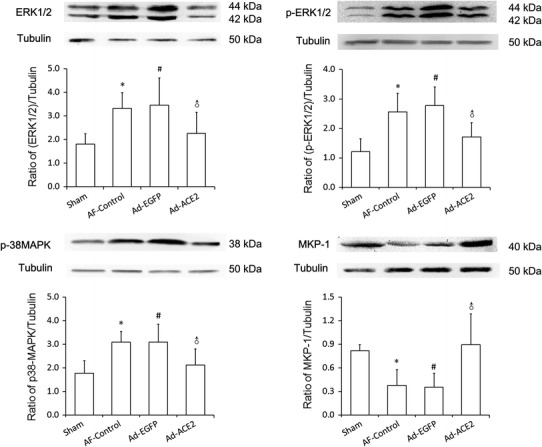
Fig. 6.

Western blot analysis of MAPKs and MPK-1 protein levels from atrial tissues. Compared to Sham and Ad-ACE2 group, the protein expression level of p38, ERK1/2 and p-ERK1/2 in AF-control and Ad-EGFP group were significantly higher, but the protein expression level of MKP-1 was lower. *p < 0.05 versus sham; # p < 0.05 versus sham; ♂ p < 0.05 versus AF-control and Ad-EGFP (n = 7)
