
Fig. 1.
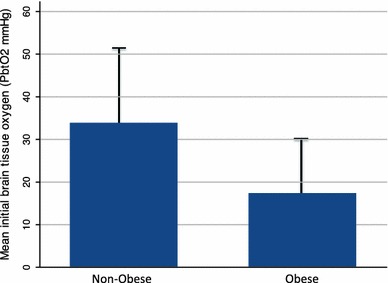
Histograms representing mean (SD) PbtO2 values according to the patients’ body mass (BMI) index at admission. Obese patients (BMI ≥ 30) had significantly lower mean daily PbtO2 values than non-obese patients (BMI < 30); P = 0.03
Official websites use .gov
A
.gov website belongs to an official
government organization in the United States.
Secure .gov websites use HTTPS
A lock (
) or https:// means you've safely
connected to the .gov website. Share sensitive
information only on official, secure websites.
Histograms representing mean (SD) PbtO2 values according to the patients’ body mass (BMI) index at admission. Obese patients (BMI ≥ 30) had significantly lower mean daily PbtO2 values than non-obese patients (BMI < 30); P = 0.03