
Fig. 7.
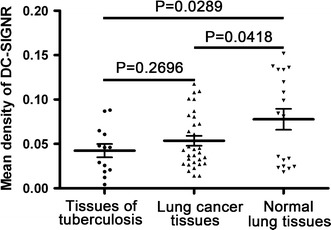
Semi-quantitative image analysis of DC-SIGNR expression in tissues. The graph displays a scatter plot of the levels of DC-SIGNR expression in lung tissues from lung cancer patients, tuberculosis patients, and normal controls. There was a statistical significance in IHC for DC-SIGNR expression between lung cancer tissues and normal lung tissues (P = 0.0418), tuberculosis tissues and normal controls (P = 0.0289). There was no significantly difference between lung cancer patients and tuberculosis patients (P = 0.2696). DC-SIGNR expression in lung cancer patients was lower than in normal lung tissues