
Fig. 3.
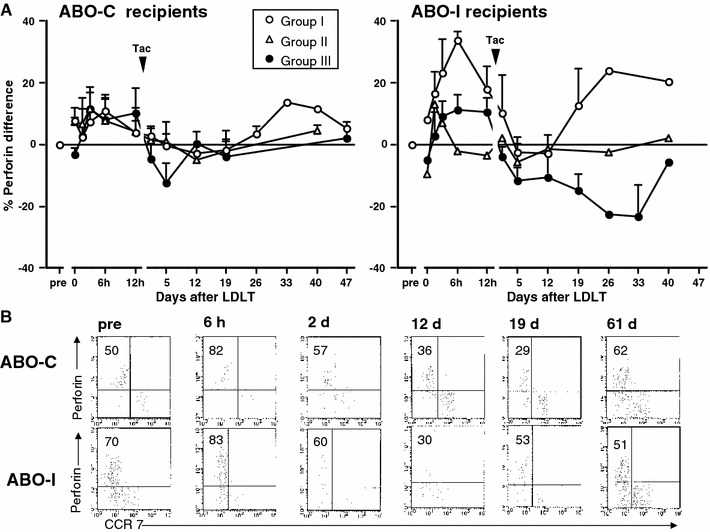
Changes in the % difference of perforin in CD8+ effector T cells after LDLT in three groups of ABO-C and ABO-I recipients. a The proportion of perforin expression is expressed as % of CD8+ T cells. b Flow cytometry of representative ABO-C and ABO-I group III recipients. Dot plots show double staining for perforin/CCR7. Perforin/CCR7 was gated on CD8+CD45RO−. Cells in the upper left are presented as %.
Tac, tacrolimus; LDLT, living donor liver transplantation