
Fig. 1.
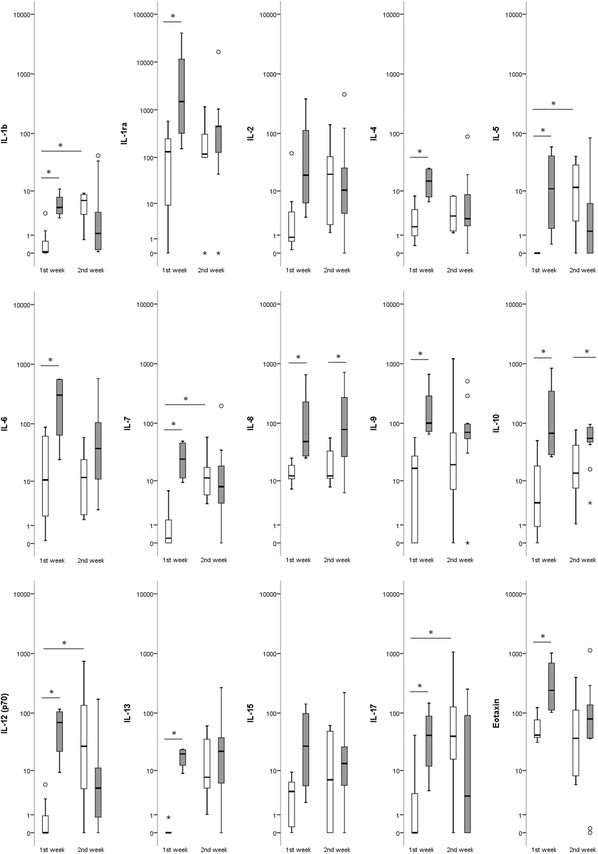
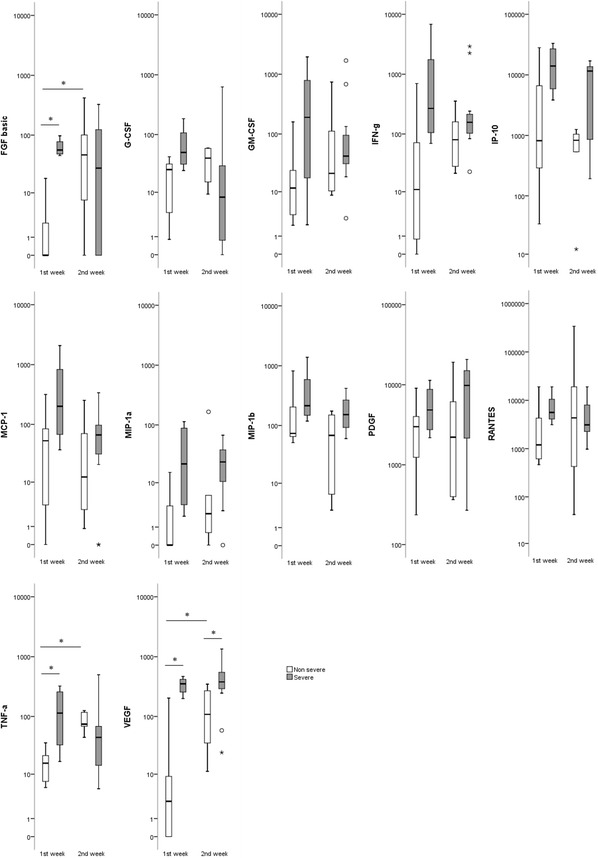
Box plots showing the serum cytokine levels (pg/ml) in patients with DOBV infection in the first (A) and second (B) week of illness. The vertical line with whiskers shows the range of values. Spots show individual outlier samples. Asterisks indicate statistical significance (p < 0.05; Mann-Whitney U test)