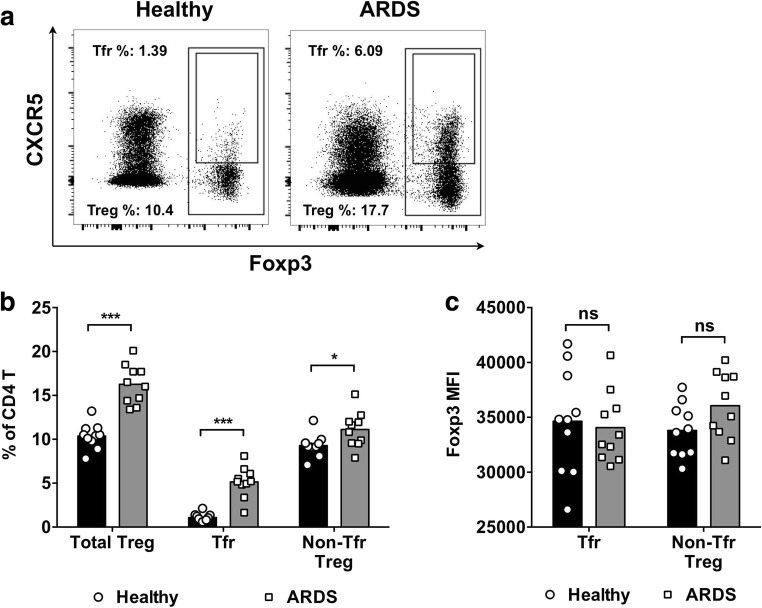
Fig. 1.
The frequency of Treg cells and Tfr cells in the PBMCs from ARDS patients and healthy controls. a Fresh PBMCs from ARDS patients and healthy controls were collected and examined using flow cytometry directly ex vivo. Figures shown were pre-gated on CD4+ T cells from one representative ARDS patient and one representative healthy control. Treg cells were gated as total Foxp3+ CD4+ T cells, and Tfr cells were gated as Foxp3+CXCR5+ CD4+ T cells. b The frequencies of Treg cells, Tfr cells, and non-Tfr Treg cells in the PBMCs from ten healthy controls and ten ARDS patients. c The mean fluorescence intensity (MFI) of Foxp3, compared between Tfr cells and non-Tfr Treg cells in healthy controls and ARDS patients. Unpaired t test with Welch’s correction. ***P < 0.001. NS not significant

