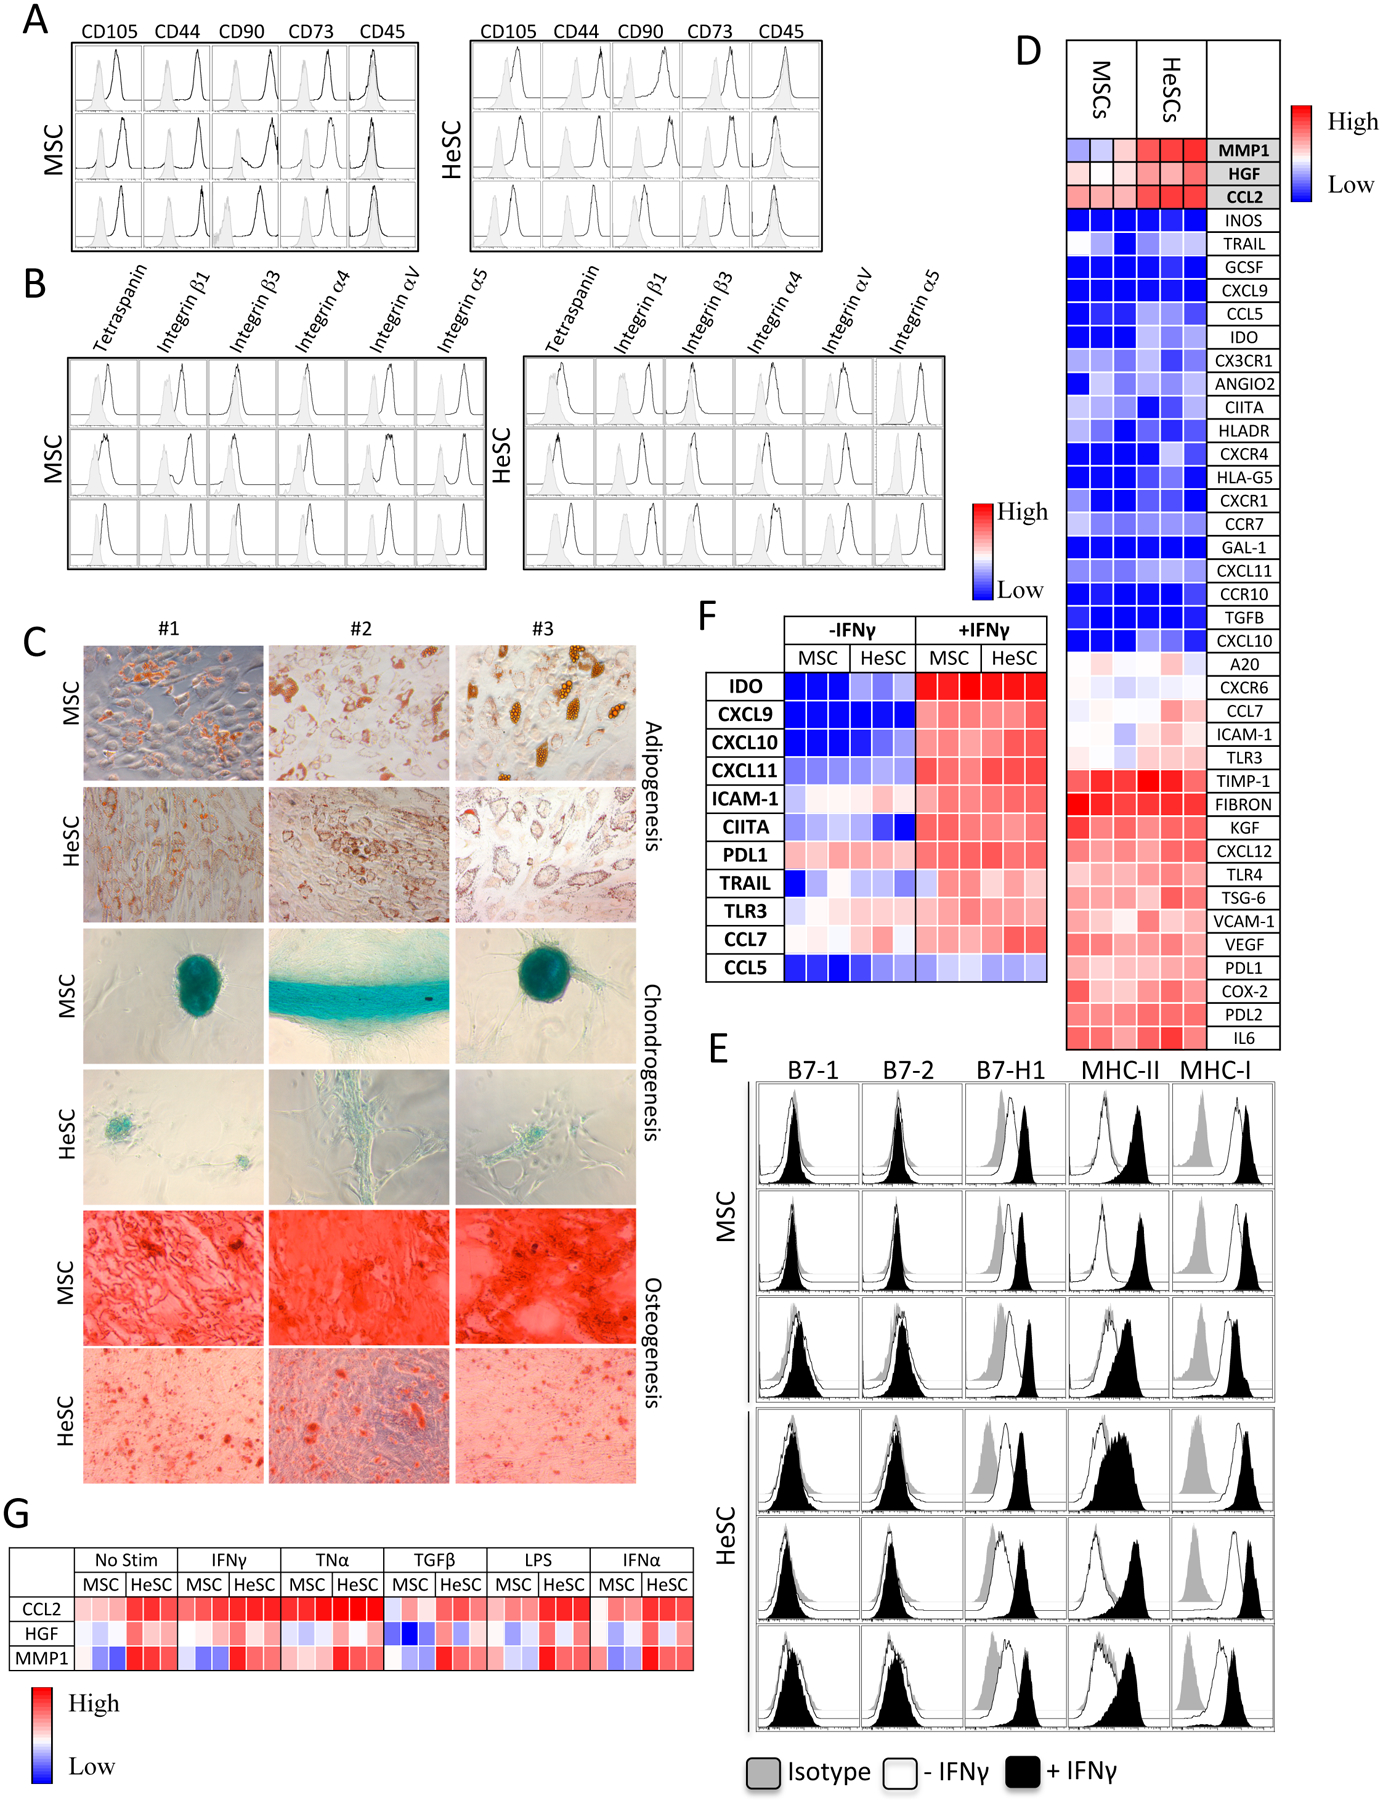
Figure 1. Phenotype and molecular genetic responses of human MSCs and HeSCs.

Human BM-MSCs and primary liver derived HeSCs (n=3 donors each) were analyzed for (A) Phenotypical markers (CD105+CD44+CD90+CD73+CD45−) and (B) adhesive molecule profile, Tetraspanin (CD63), Integrin β1 (CD29), Integrin β3 (CD61), Integrin α4 (CD49d), Integrin alpha V (CD51), Integrin alpha 5 (CD49e). Open and grey histograms represent marker and isotype controls respectively. (C) BM-MSCs/HeSCs were subjected to adipogenesis, chondrogenesis and osteogenesis induction for a period of 15–20 days and stained with Oil Red O, Alcian Blue and Alizarin Red S respectively.. (D) Human BM-MSCs/HeSCs (n=3 donors each) were analyzed for the expression of 40 genes through Fluidigm nanoscale quantitative PCR. Heat map represents the relative CT values that are normalized to endogenous GAPDH control. (E) BM-MSCs/HeSCs were stimulated with IFNγ for 48 hours and analyzed for the expression of HLA-ABC, HLA-DR, B7–1, B7–2 and B7H1 by flow cytometry. Open and dark histograms represent – or + IFNγ respectively. Grey histograms at each plot represent the isotype control. (F) BM-MSC or HeSCs (n=3 donors each) were stimulated with 20 ng/mL IFNγ for 48 hours, and total cDNA were generated from RNA. Transcriptional profiles of 11 genes were investigated in Fluidigm nanoscale quantitative PCR. Heat map represents the relative CT values that are normalized to endogenous GAPDH control. (G) BM-MSC or HeSCs (n=3 donors each) were stimulated with 20–25ng/ml IFNγ, TNFα, LPS, TGFβ and IFNα for 48 hours. Expression levels of CCL2, HGF and MMP-1 were assessed by Fluidigm nanoscale quantitative PCR. Heat map represents the relative CT values that are normalized to endogenous GAPDH control.
