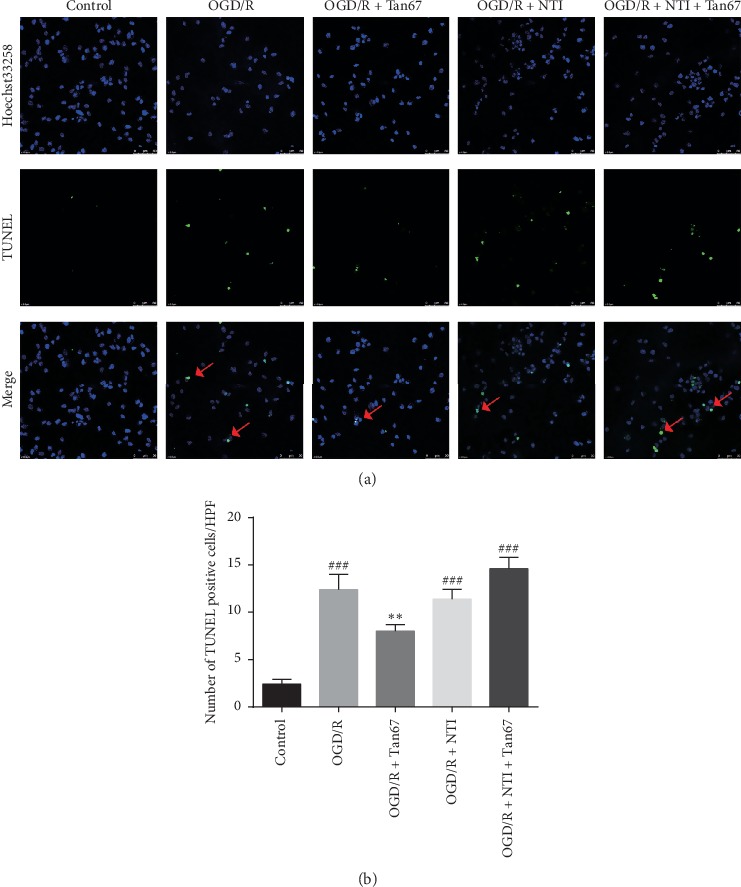
Figure 2.

DOR activation protects against OGD/R-induced cell apoptosis. The apoptotic cells were evaluated after exposure to 6 h OGD followed by 24 h reperfusion (OGD/R). (a) The top panels are representative images of TUNEL staining (400x) in indicated groups. Red arrows indicate colocalization (yellow) between TUNEL-positive apoptotic cells (green) and cell nuclei (blue) in PC12 cells. Cell nuclei were visualized by Hoechst 33258 staining (blue). (b) The bottom panel is the statistical analysis of the number of apoptotic cells. DOR activation reduced cell apoptosis, and NTI blocked the effect. Scale bar = 50 μm. N = 3 in each group. ###P < 0.001 vs. control group and ∗∗P < 0.01 vs. OGD/R group.
