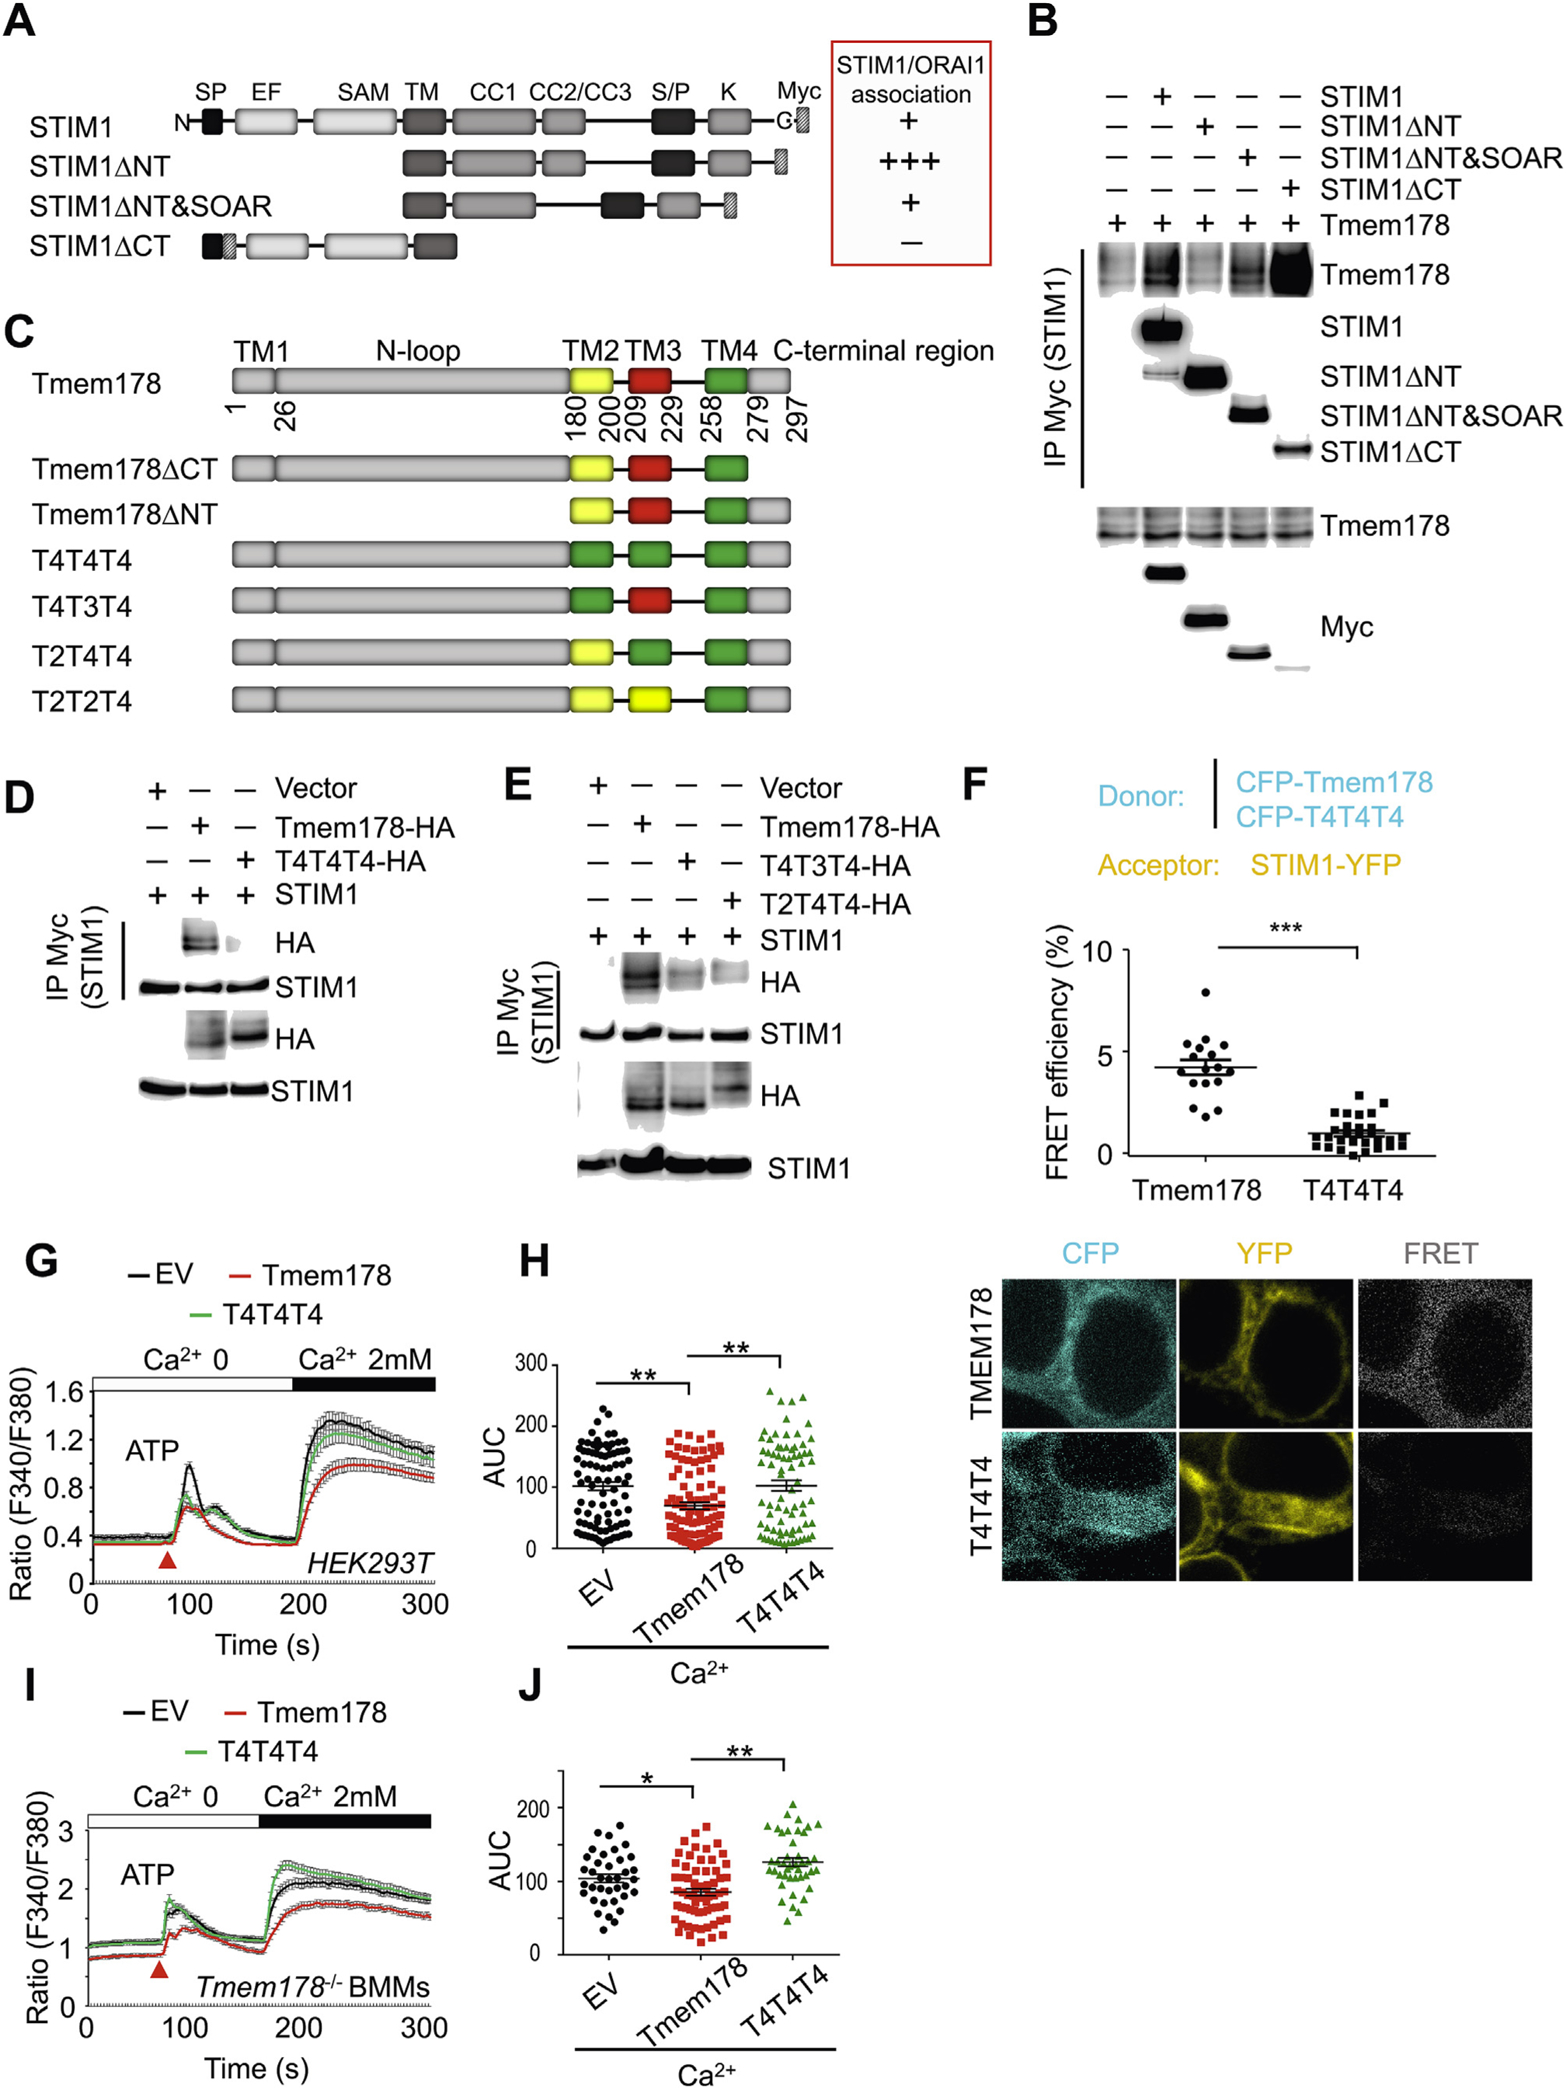
Fig. 3.

STIM1 and Tmem178 associate via their transmembrane regions. (A) Schematic diagram of indicated STIM1 mutants. Based on published data, the binding of each STIM1 mutant with ORAI1 is shown in the red box as + + +, +, and − (from the strongest to the weakest). (B) Co-IP and Western blot showing association between Tmem178-HA and indicated Myc-tagged STIM1 mutants in HEK293T cells. (C) Schematic diagram ofTmem178 mutants. (D, E) Co-IPs followed by Western blot showing association between the HA-tagged Tmem178 mutants and STIM1-Myc in HEK293T cells. (F) Quantification of % FRET efficiency (top) and representative images (bottom) between STIM1-YFP and CFP- Tmem178 (n = 17), or STIM1-YFP and CFP-T4T4T4 (n = 29) in HEK293T cells. One of 3 independent experiments is shown. (G, H) Calcium traces and AUC in HEK 293 T cells expressing STIM1, ORAI1 and EV (n = 88), full-length Tmem178 (n = 98) or Tmem178- T4T4T4 mutant (n = 82) stimulated with ATP and 2 mM calcium. (I, J) Calcium traces and AUC in Tmem178−/− BMMs infected with EV (n = 37), full-length Tmem178 (n = 70) or Tmem178-T4T4T4 mutant (n = 42) stimulated with ATP and 2mM calcium. Calcium traces from indicated number of cells are from a representative experiment. Data are shown as mean ± SEM. *P < 0.05, **P < 0.01, ***P < 0.001. (For interpretation of the references to colour in this figure legend, the reader is referred to the Web version of this article.)
