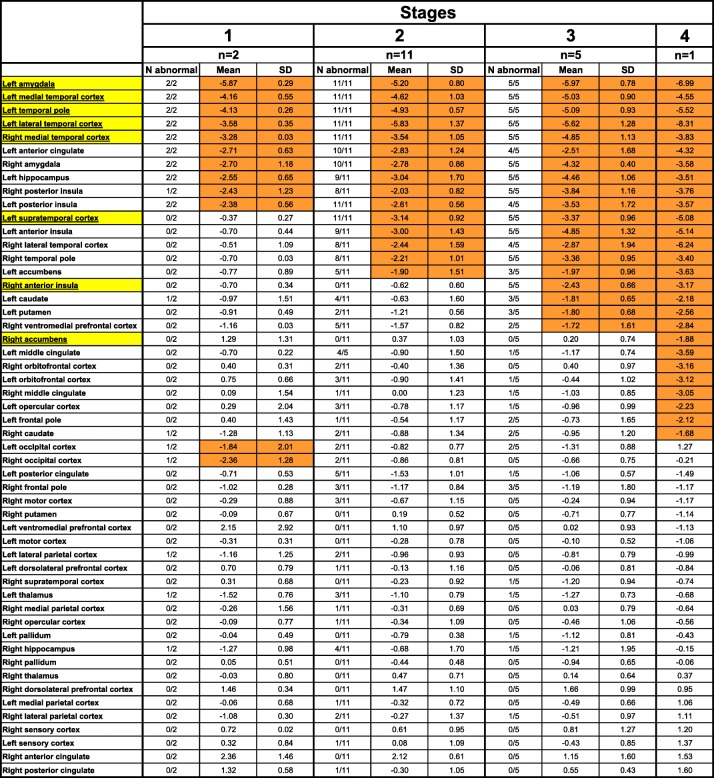
Table 1.
Staging system of FTLD-TDP type C with all cortical and subcortical regions used in the analysis shown by mean w-score at each stage. Yellow denotes the regions chosen to define the stages, and orange denotes abnormal w-scores. Values denote mean and standard deviation (SD) for the w-scores. “n” is the number of cases falling into each stage. “N abnormal” is the number of cases with a w-score < − 1.65 in each stage for each region. Note that the abnormal mean occipital volume in Stage 1 is driven by a single patient with a lower quality segmentation and therefore likely to be artefactual

