
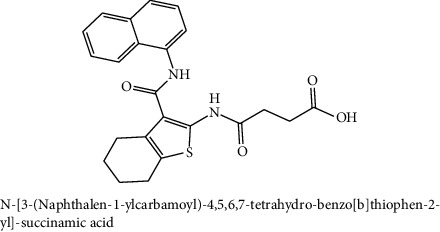
Table 2.
The chemical structures of top six scoring ligand molecules against MLAA-42 protein.
| S. no. | Structure and IUPAC name of molecule | Glide energy (KJ/Mol) | Binding energy (Kcal/mol) | The interacting amino acid residues | Bond distance (Å) |
|---|---|---|---|---|---|
| 1 |

|
−63.59 | −12.19 | H-bonds | |
| LYS40 : N – L1 | 2.91 | ||||
| THR98 : N – L1 | 2.50 | ||||
| ILE100 : N – L1 | 2.67 | ||||
| LYS40 : O – L1 | 2.32 | ||||
| ILE96 : O – L1 | 2.18 | ||||
| THR98 : O – L1 | 2.15 | ||||
|
| |||||
| 2 |

|
−50.27 | −11.83 | H-bonds | |
| TYR38 : N – L2 | 2.89 | ||||
| ILE100 : N – L2 | 2.99 | ||||
| TYR38 : O – L2 | 1.94 | ||||
| π-π interactions | |||||
| TRP85-L2 | 4.95 | ||||
|
| |||||
| 3 |
|
−42.22 | −11.61 | H-bonds | |
| ILE100 : H – L3 | 1.68 | ||||
| THR98 : O – L3 | 2.36 | ||||
| TYR38 : O – L3 | 2.00 | ||||
|
| |||||
| 4 |

|
−47.52 | −11.30 | H-bonds | |
| LYS40 : N – L4 | 2.95 | ||||
| THR98 : N – L4 | 2.65 | ||||
| THR98 : O – L4 | 2.26 | ||||
|
| |||||
| 5 |

|
−39.53 | −11.12 | H-bonds | |
| LYS40 : N – L5 | 2.67 | ||||
| THR98 : O – L5 | 2.13 | ||||
| ASP99 : OD1-L5 | 2.79 | ||||
| π-π interactions | |||||
| TRP85-L5 | 4.87 | ||||
|
| |||||
| 6 |

|
−40.65 | −11.10 | H-bonds | |
| ILE100 : N – L6 | 2.69 | ||||
| TYR38 : O – L6 | 2.30 | ||||
| THR98 : OG1-L6 | 2.29 | ||||
Table represents top six ligand molecules with binding energies in range of −12.19 to −9.22 Kcal/mol, hydrogen bonds, and pi-interactions to MLAA-42's active site pocket.