
Figure 8.
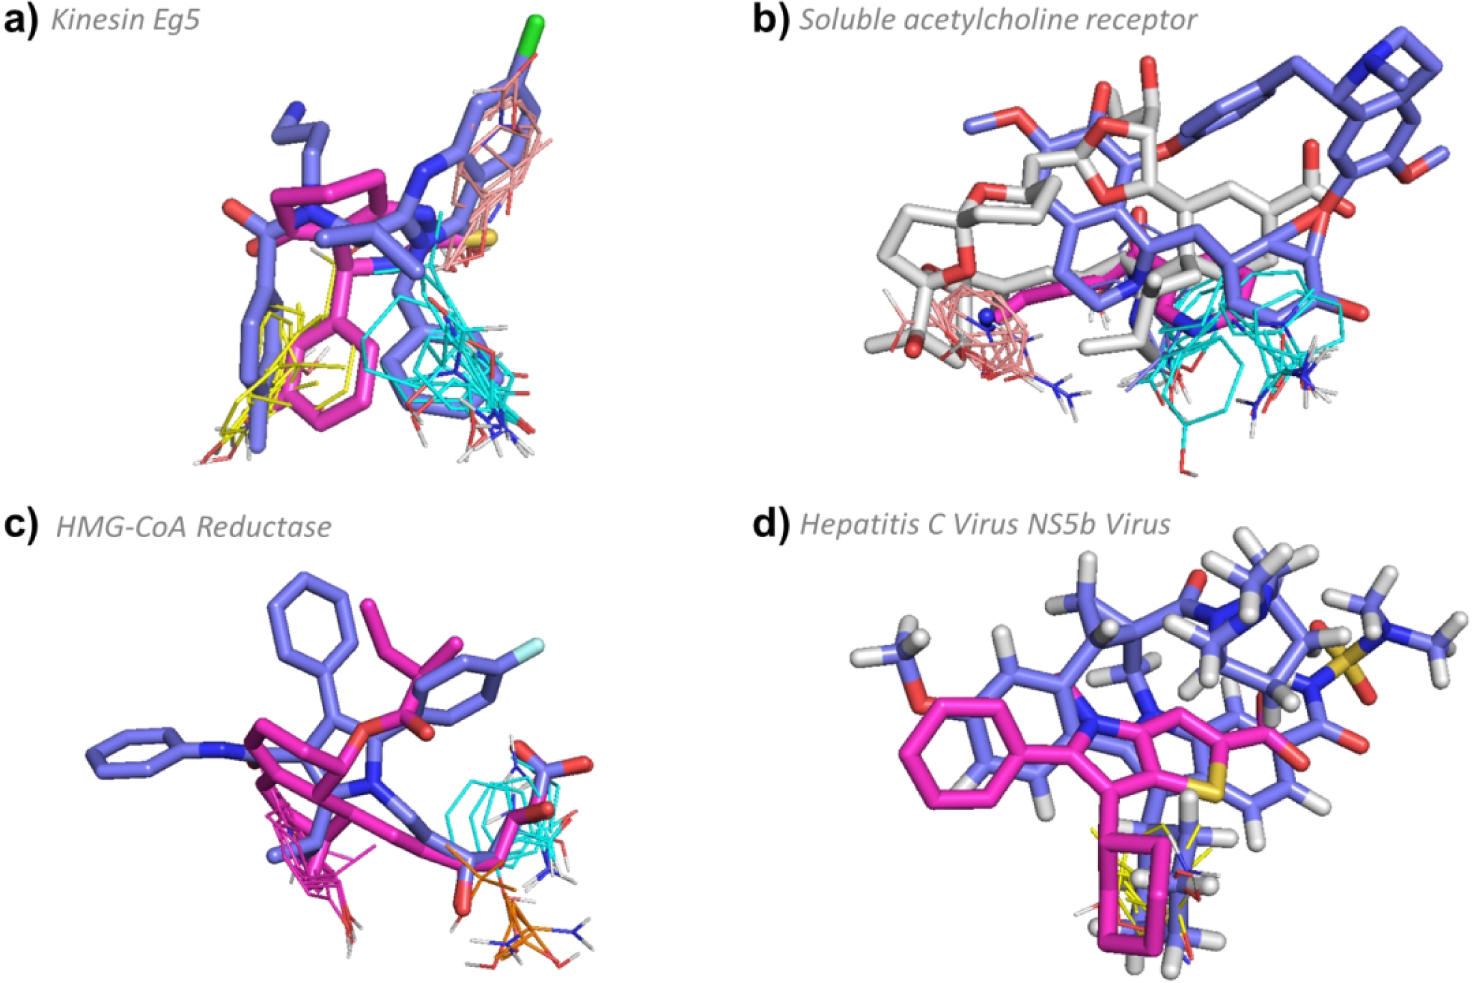
FTMap determined hot spot structure of Type III targets with example ligands bound. Pink ligands represent smaller compounds, whereas blue ligands represent the eRo5/bRo5 drug/clinical candidate identified by Doak et al. White ligands (where applicable) show compounds larger than the Doak et al., identified ligand. FTMap hot spots are colored according to standard output as shown in Figure 1. a) Hot spot structure of kinesin Eg5 (4A5Y). Ispinesib (4A5Y:G7X, MW = 517.06 Da, KI = 2.3 nM, pBA = 8.64), and (S)-enastron (2X7C:KZ9, MW = 274.34 Da, IC50 = 2 μM, pBA = 5.7) are shown in blue and pink, respectively. b) Hot spot structure of soluble acetylcholine receptor (3PMZ). Tubocurarine (3PMZ:TUB MW = 609.73 Da, KI = 3481.0 nM, pBA = 5.46), (2WNL:AN5, MW = 178.23 Da, KI = 120 μM, pBA = 6), and pinnatoxin A (4XHE:40P, MW = 711.92 Da, KD < 0.05 nM, pBA = 10.3) are shown in blue, pink, and white, respectively. c) Hot spot structure of HMG-CoA reductase (1HWK). Atorvastatin (1HWK:117, MW = 558.64 Da, KI = 6.2 nM, pBA = 8.21) and mevastatin (1HW8:114, MW = 408.53 Da, IC50 = 23 nM, pBA = 7.64) are shown in blue and pink, respectively . d) Hot spot structure of Hepatitis C Virus NS5b Subunit (4NLD). Beclabuvir (4NLD:2N7, MW = 659.84 Da, IC50 = 0.02 μM, pBA = 7.7) and (2WCX:VGC, MW = 339.45 Da, IC50 = 0.025 μM, pBA = 7.6) are shown in blue and pink, respectively.