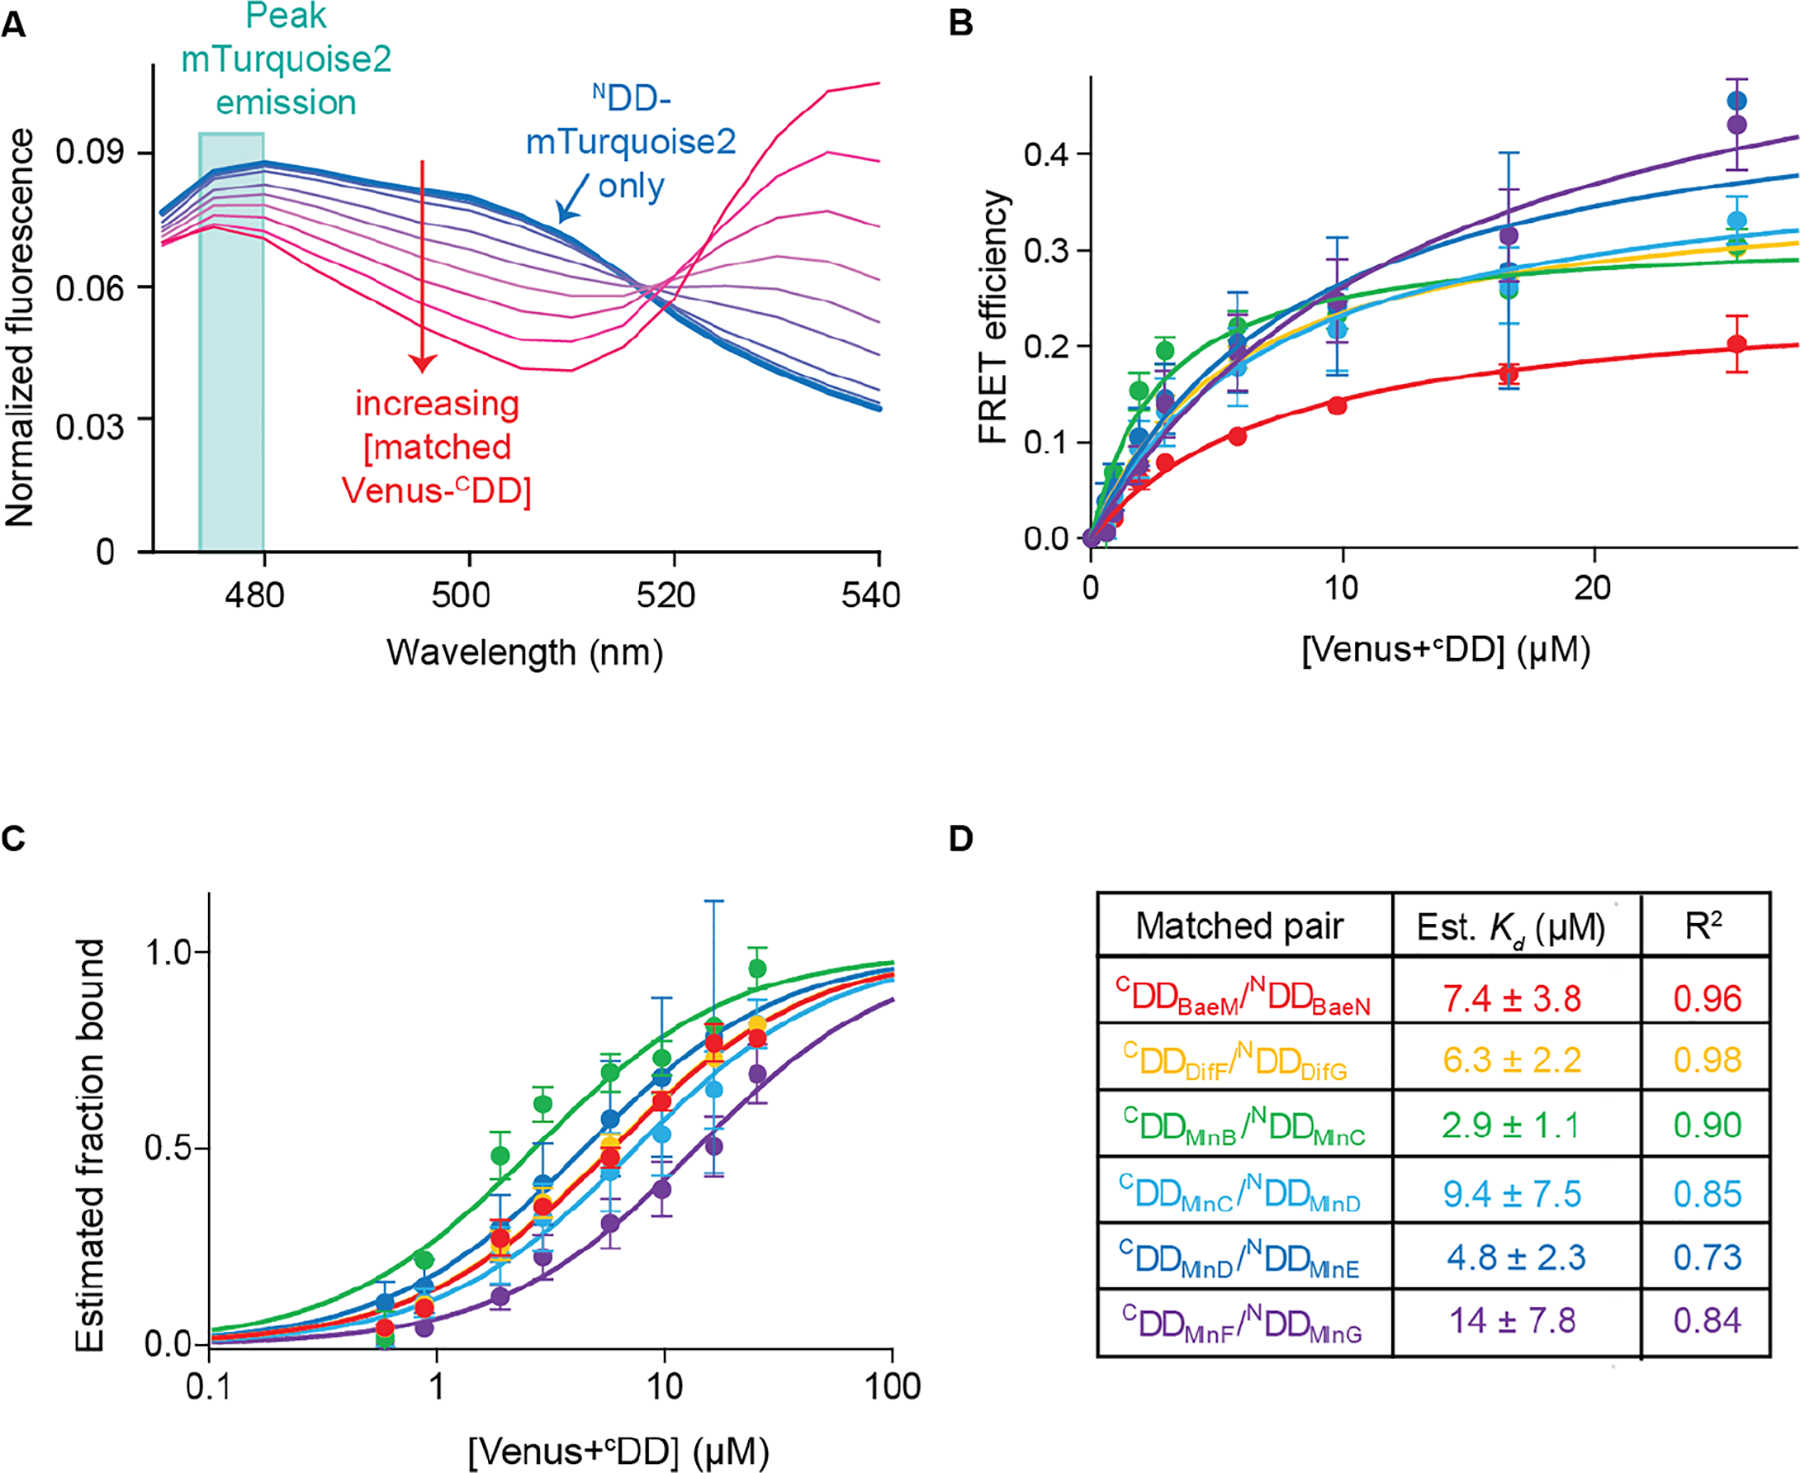
Figure 5.

Estimating binding constants from the titration curves of matched pairs. (A) Plot showing normalized fluorescence curves obtained from titrating an increasing amount of Venus+CDD to its cognate NDD+mTurquoise2. The trace obtained from NDD+mTurquoise2 is shown as the thick blue line; traces obtained with increasing Venus+CDD concentration are shown as thinner purple to red lines. The turquoise box outlines the peak NDD+mTurquoise2 (donor) fluorescence at 475–480 nm. (B) Plots of the FRET efficiency E by Venus+CDD concentration for all matched pairs. Each color corresponds to a different matched pair: Venus+CDDBaeM/NDDBaeN+mTurquoise2, red; Venus+CDDDifF/NDDDifG+mTurquoise2, orange; Venus+CDDMlnB/NDDMlnC+mTurquoise2, green; Venus+CDDMlnC/NDDMlnD+mTurquoise2, light blue; Venus+CDDMlnD/NDDMlnE+mTurquoise2, blue; Venus+CDDMlnF/NDDMlnG+mTurquoise2, purple. The data were fit well by a single-site binding curve function, as shown by the solid lines. Each point is the average of three replicates. Error bars correspond to standard deviations. (C) Plots of estimated fraction of NDD+mTurquoise2 bound at each Venus+CDD concentration using the data shown in panel B. (D) Estimated dissociation constant (Kd) values of matched pairs and R2 of fit to eq 3. Standard deviations are indicated.
