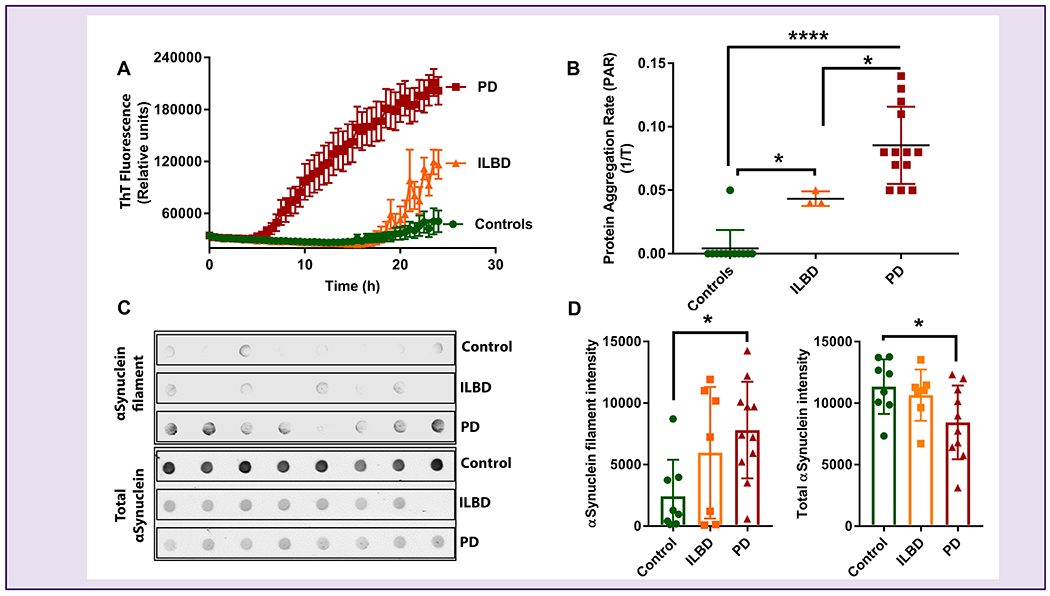
Figure 2.

Reproducible detection of paS seeding activity in SMG homogenates.
(A) ThT fluorescence in PD, ILBD, and control SMG homogenates, showing more paS in PD and ILBD samples. (B) Comparison of PAR between the PD, ILBD, and control SMG homogenate samples showing higher paS load in PD and ILBD. We tested 13 PD (red), 3 ILBD (orange), and 12 control (green) samples in the αSyn RT-QuIC assay. One-way ANOVA was used to compare the three groups and all samples were tested in quadruplicates and expressed as the mean and standard error of 4 technical replicates. (C) A representative Dot blot image consisting of PD, ILBD, and control SMG RT-QuIC end products with αSyn filament conformation-specific (top panel) and total αSyn (bottom panel) antibodies. (D) Densitometric analyses of αSyn filament and total αSyn levels, showing that the RT-QuIC end products of PD wells showed the highest levels of misfolded αSyn compared to ILBD and control wells, while total αSyn levels were higher in controls compared to other groups. ****p ≤ 0.0001, *p ≤ 0.05.
