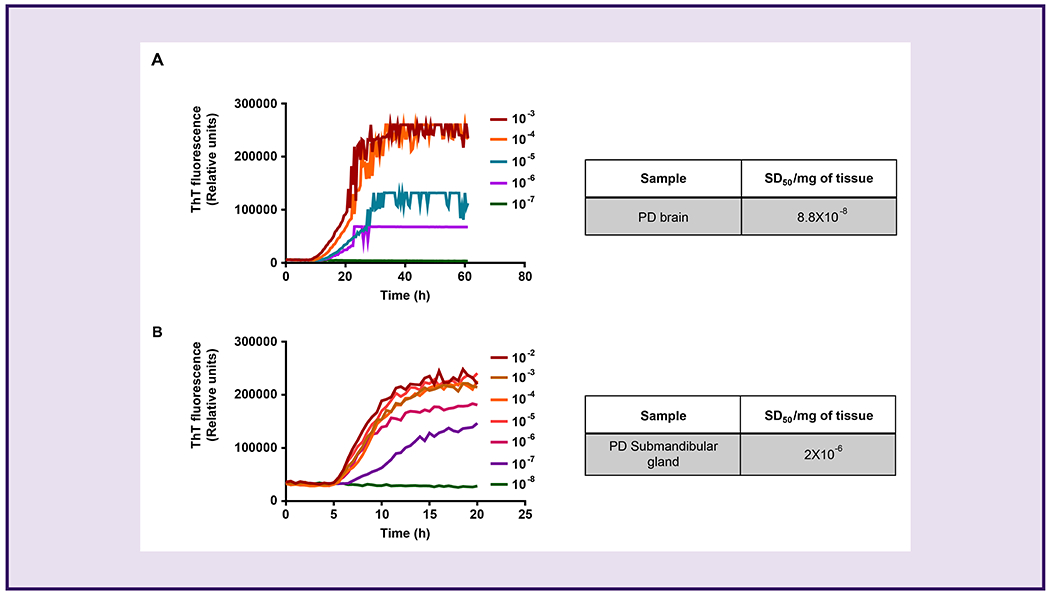
Figure 4.

Determination of median seeding dose (SD50) of paS in PD samples using the αSyn RT-QuIC assay.
End-point dilutions of PD brain homogenates (A) and SMG tissue samples (B) by αSyn RT-QuIC. Each trace represents the average of 4 replicates. Tables to the right of each graph indicate the concentration of SD50 units calculated by Spearman-Kärber analysis representing one brain homogenate and two SMG samples.
