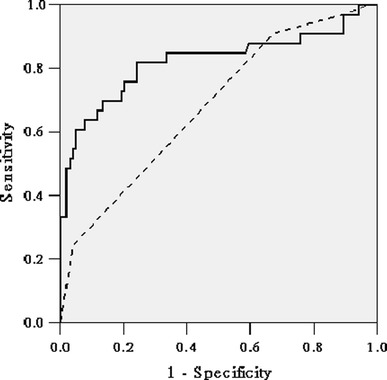
Fig. 2.

Receiver operating characteristic (ROC) curves for the model for end-stage disease (MELD) and Child-Turcotte-Pugh (CTP) prognostic models in predicting 1-month mortality rates after OLT. Solid line: MELD score; dotted line: CTP score. For the entire cohort of 137 patients, the area under the curve (AUC) values were 0.82 [95% confidence interval (95% CI) 0.72–0.92] for MELD and 0.68 (95% CI 0.58–0.79) for CTP. P < 0.01 for the difference between the AUC values for MELD and CTP
