
Fig. 4.
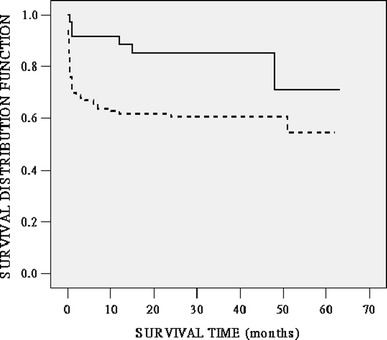
Kaplan–Meier survival function for up to 5 years after OLT according to the preoperative CTP score. Solid line: 40 patients with CTP scores < 12.5; dotted line: 97 patients with CTP scores ≥ 12.5. The difference in survival rates between these two subgroups was statistically significant (P = 0.01 by the log-rank test)