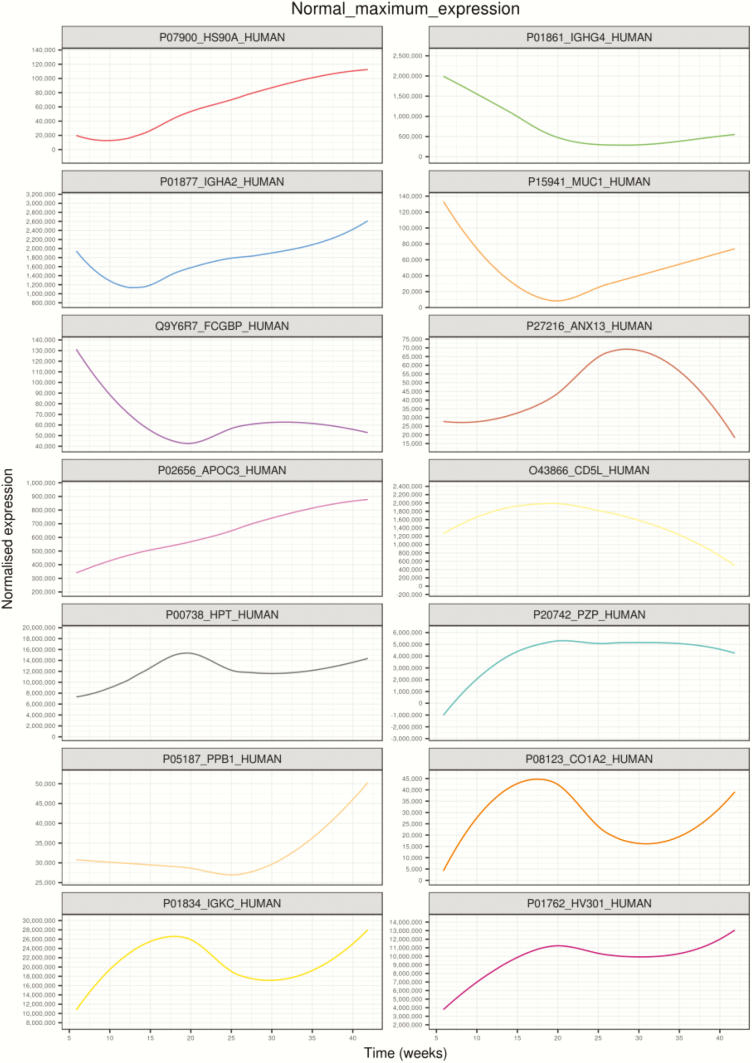
Figure 3.
Highest expressed proteins in each cluster identified using linear mixed modeling for normal pregnancies across gestation. Linear mixed modeling and circular cladogram analysis for normal pregnancies across gestation were divided into 14 clusters. The highest expressed protein from each cluster was extracted and color coded based on the cluster of origin. Clusters are shown in ascending order, corresponding to (A) through (N) in Fig. 2, starting from the top of the figure, reading from left to right, and continuing onto the next line of graphs below.

