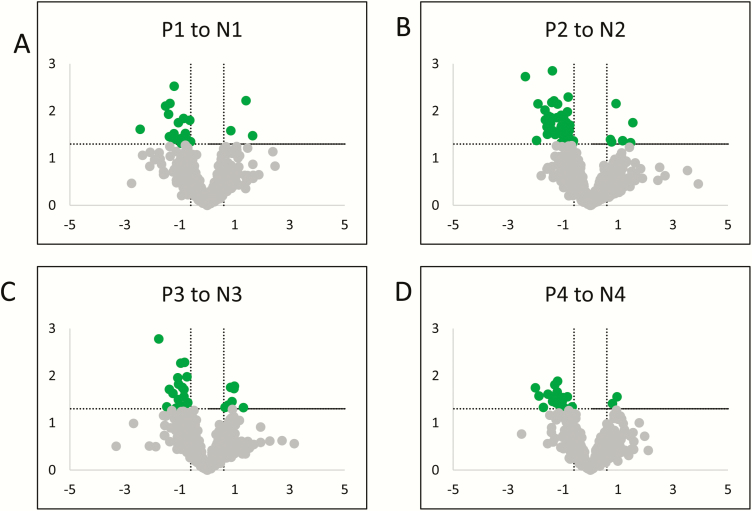
Figure 6.
Volcano plots for P1 vs N1, P2 vs N2, P3 vs N3, and P4 vs N4. Statistically significant proteins (adjusted P < 0.05) with a log2 fold change ±0.6 are represented by green dots. Differentially expressed proteins that did not reach statistical significance are represented by gray dots. P is preterm; N is normal; 1 to 3 is first through third trimester and 4 is laboring.

