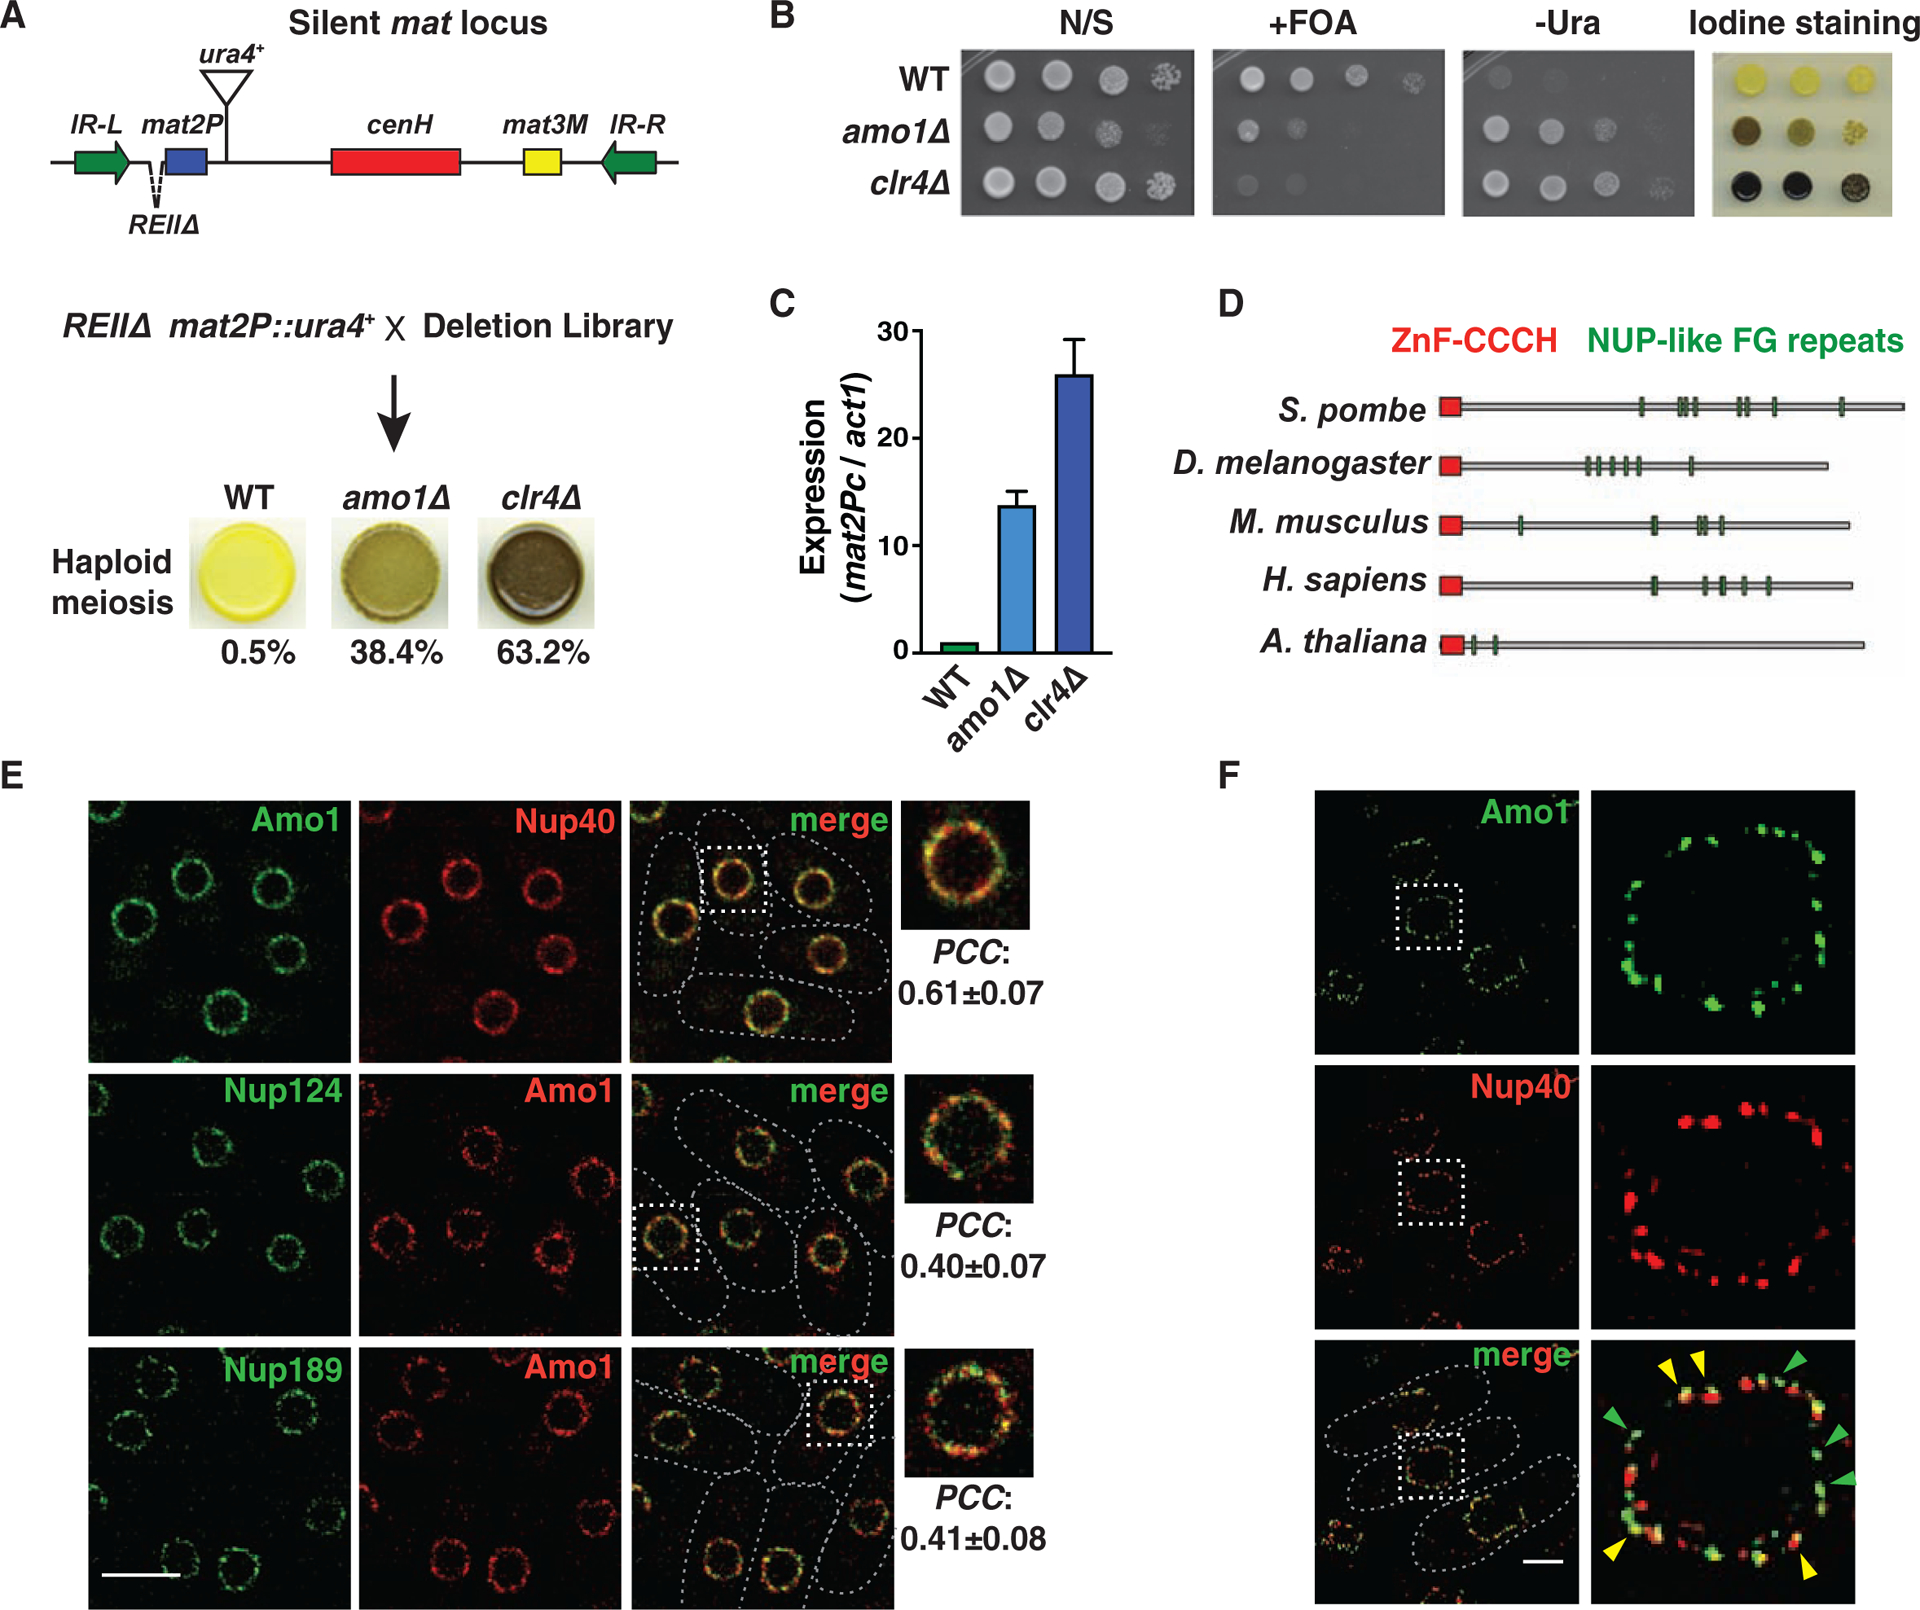
Figure 1. The nuclear rim protein Amo1 affects heterochromatic silencing.

(A) Genetic screen for factors that affect silencing of the mat locus. Cells grown on minimal media were stained with iodine vapor to detect haploid meiosis. Cells (%) that formed spores in the indicated strains is shown (n>360). (B) Tenfold serial dilution assay of the indicated strains to measure de-repression of mat2P::ura4+. (C) RT-qPCR analysis of mat2Pc expression in the indicated strains (mean ± SD, n=3). (D) Schematic showing the protein domain architecture of Amo1 orthologs. (E) Deconvolution fluorescence imaging of live cells co-expressing GFP- or mCherry-tagged Nups. Insets show magnification of the boxed regions. Co-localization was quantified by Pearson’s correlation coefficient (PCC) (mean ± SD, n>75). (F) Representative structured illumination microscopy (SIM) images. Yellow arrows indicate regions of co-localization, and green arrows show independent Amo1 puncta. See also Figure S1.
