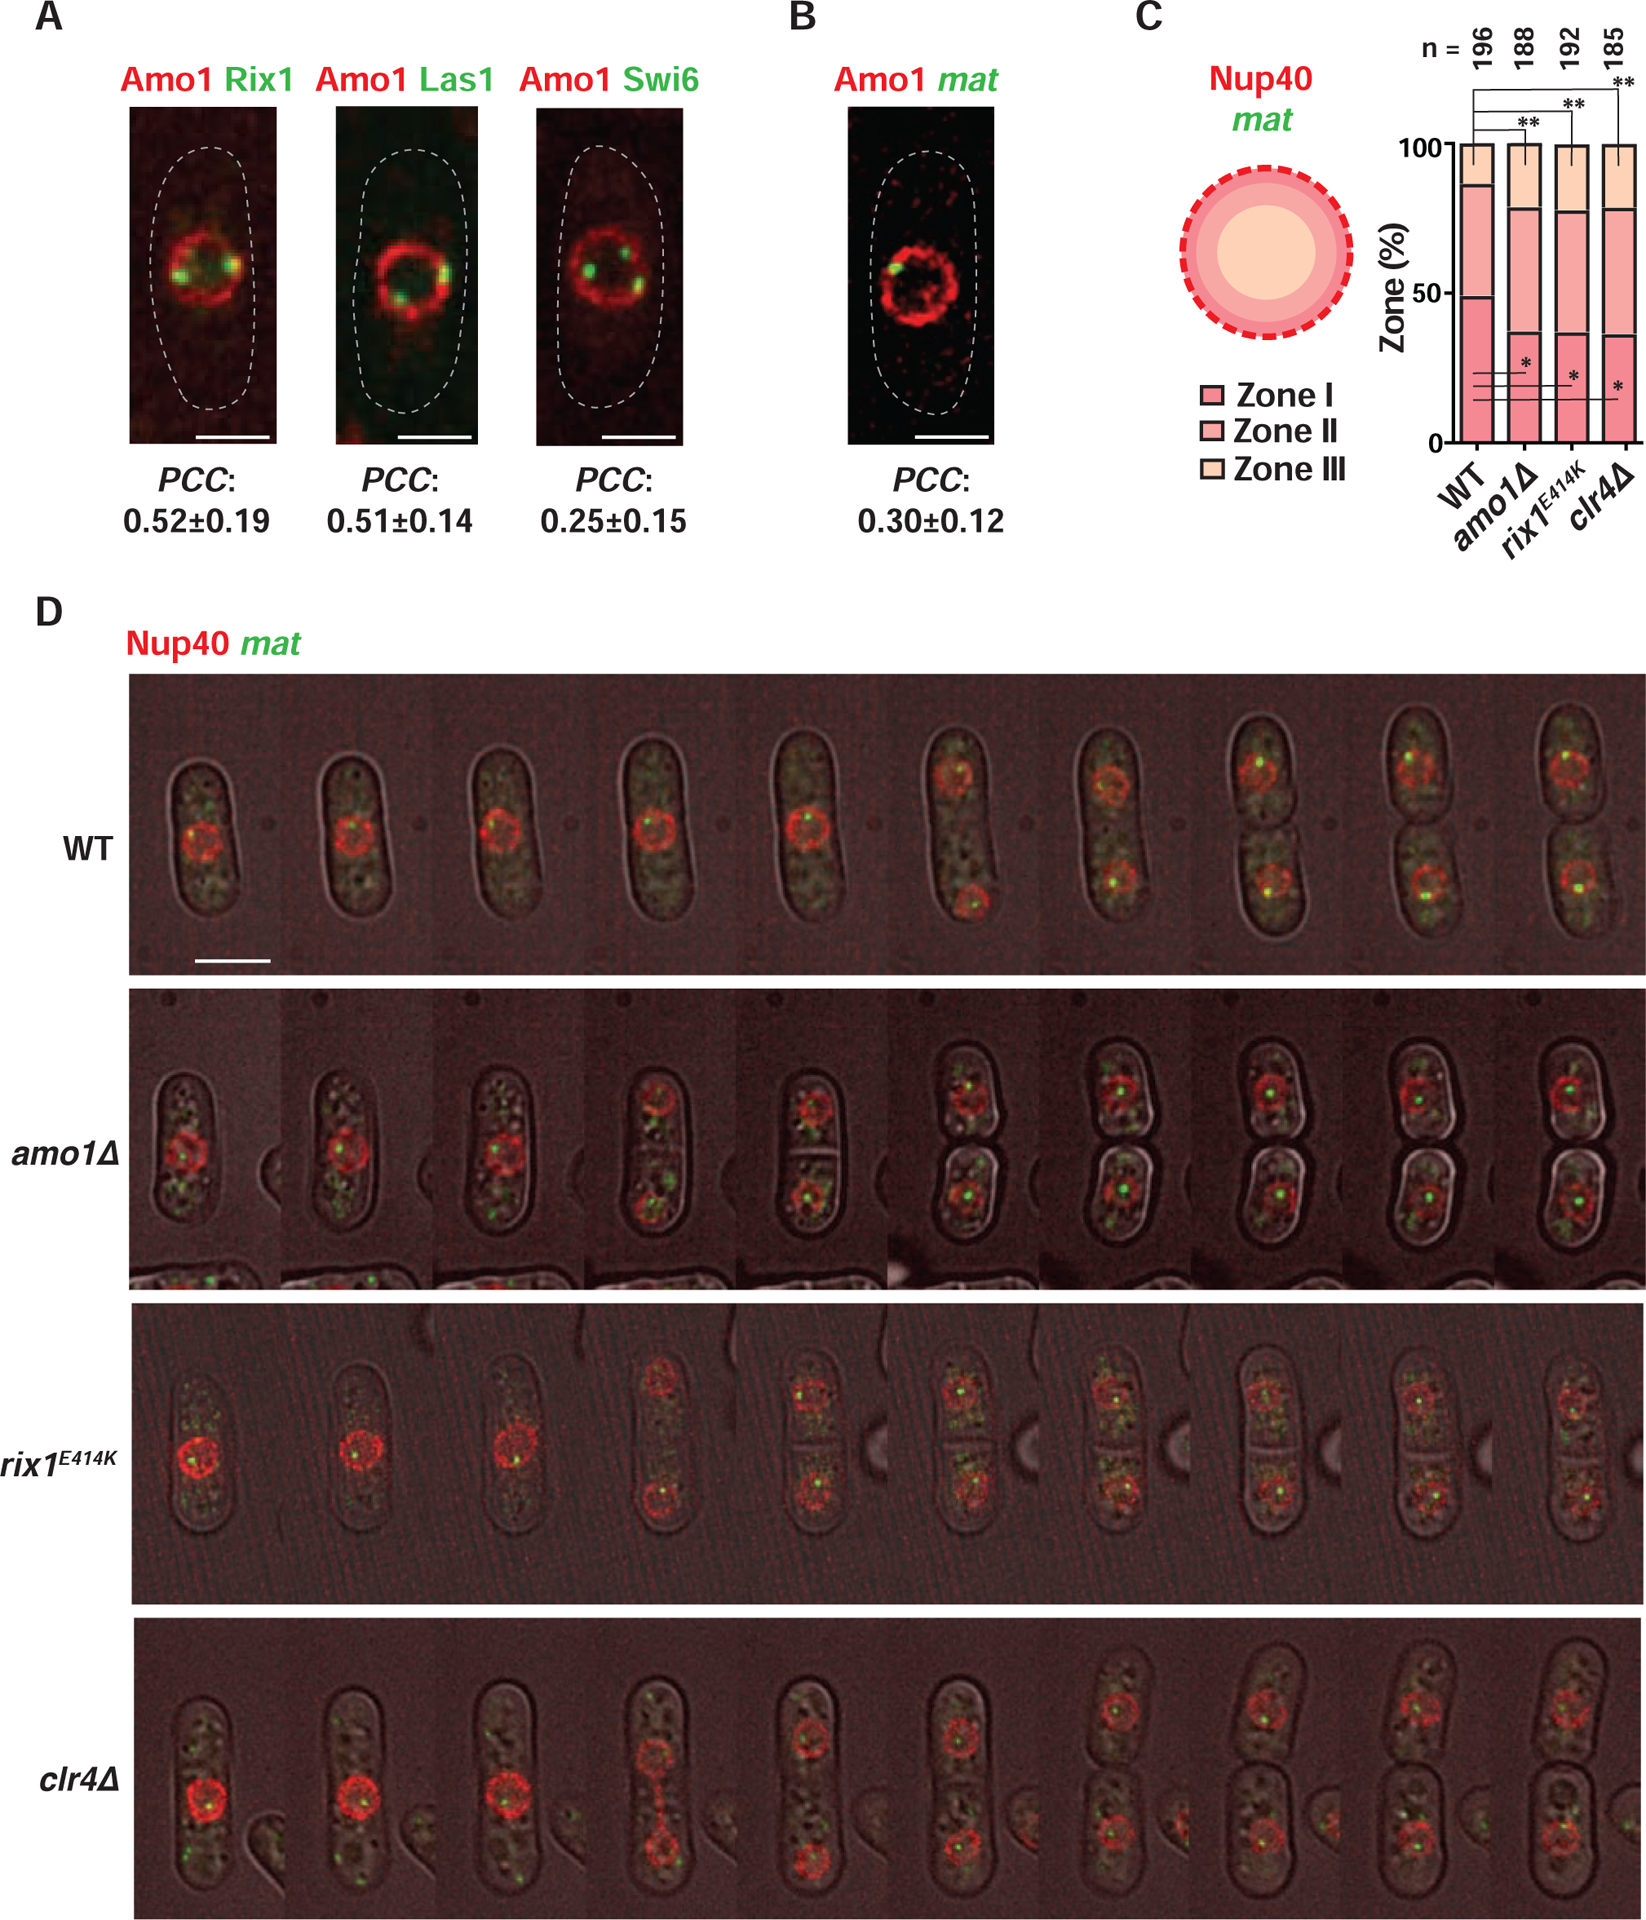
Figure 4. Amo1 affects the subnuclear localization of the mat locus.

(A and B) Representative fluorescence images of live cells co-expressing Amo1-mCherry and the indicated GFP-tagged proteins (A) or IR-R>lacO/LacI-GFP (mat) (B). Co-localization was quantified by measuring PCC in cells where Rix1, Las1, Swi6 or mat was found at the nuclear periphery (mean ± SD, n>50). (C) Schematic showing localization of mat in different nuclear zones (left) in WT and mutant cells harboring IR-R>lacO/LacI-GFP. Nup40-mCherry marks the NE. Percentage distribution of mat in each frame is counted and plotted for a total of “n” cells. *P<0.05 and **P<0.01 as determined by Student’s t-test for mat in zones I and III respectively (WT vs each mutant). (D) Time lapse images obtained at 20-min intervals are shown for the indicated strains. See also Figure S4 and Videos S1–S4.
