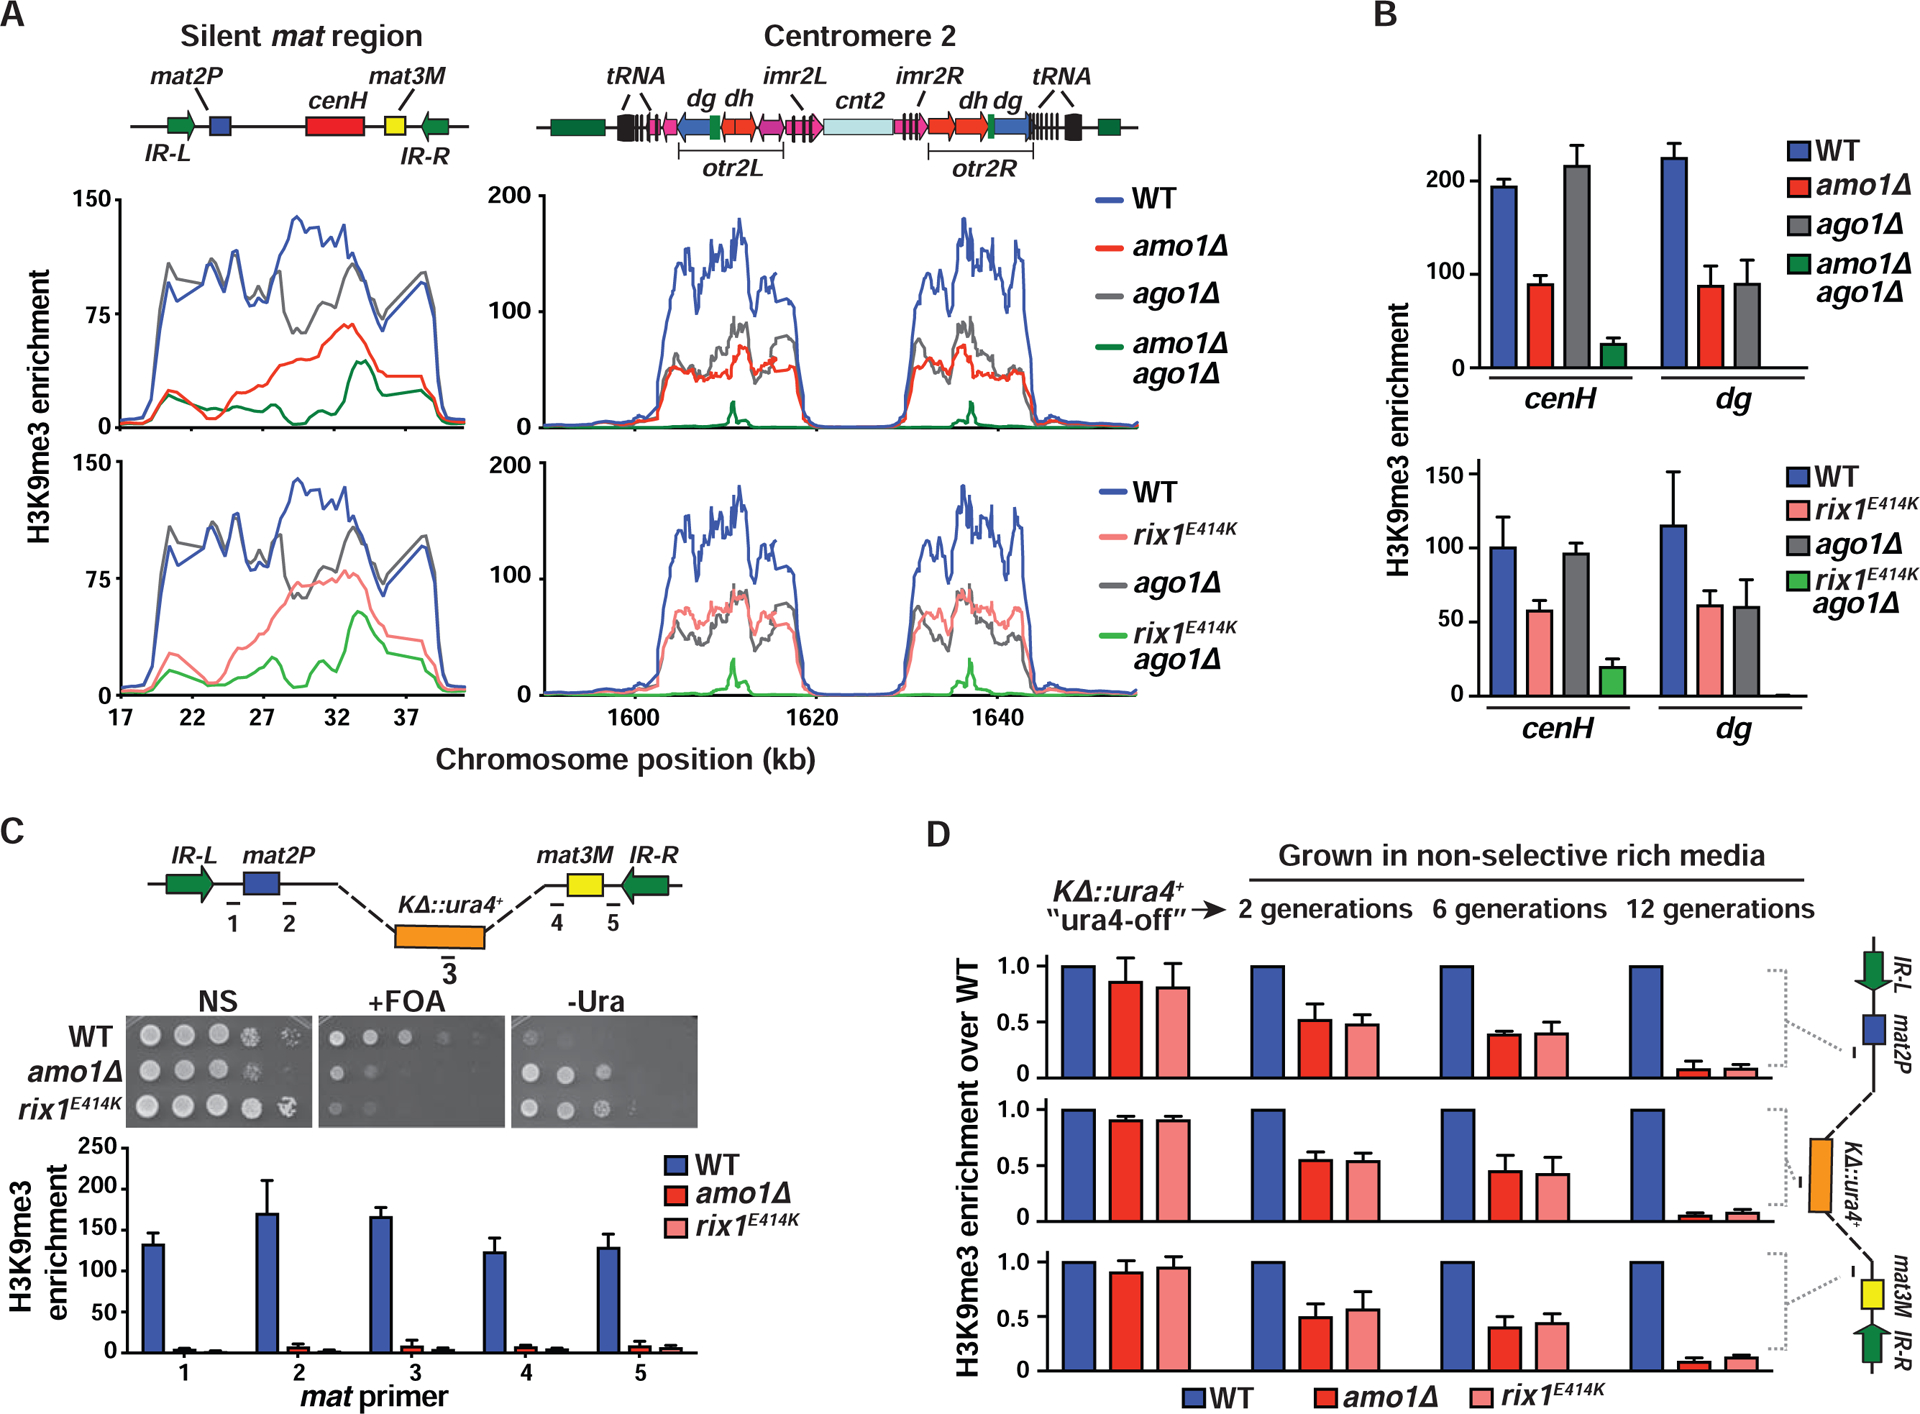
Figure 5. Amo1 and RIXC affect the epigenetic maintenance of heterochromatin.

(A and B) ChIP-chip (A) and ChIP-qPCR (mean ± SD, n=3) (B) analysis of H3K9me3 enrichments at heterochromatic regions. Note: WT and ago1Δ graphs are the same in the top and bottom panels of (A) as the experiments were performed at the same time. (C) Tenfold serial dilution assay to measure the de-repression of a ura4+ reporter that replaced the K region (KΔ::ura4+) (top). H3K9me3 analysis by ChIP-qPCR (bottom). Fold enrichment values of the target loci (marked in the schematic) are shown as the mean ± SD (n=3). (D) WT and mutant ura4-off strains collected from counter-selective FOA media were grown in non-selective rich media for 2, 6, and 12 generations. ChIP-qPCR showing H3K9me3 enrichment at the indicated loci (see schematic) (mean ± SD, n=2). See also Figure S5.
