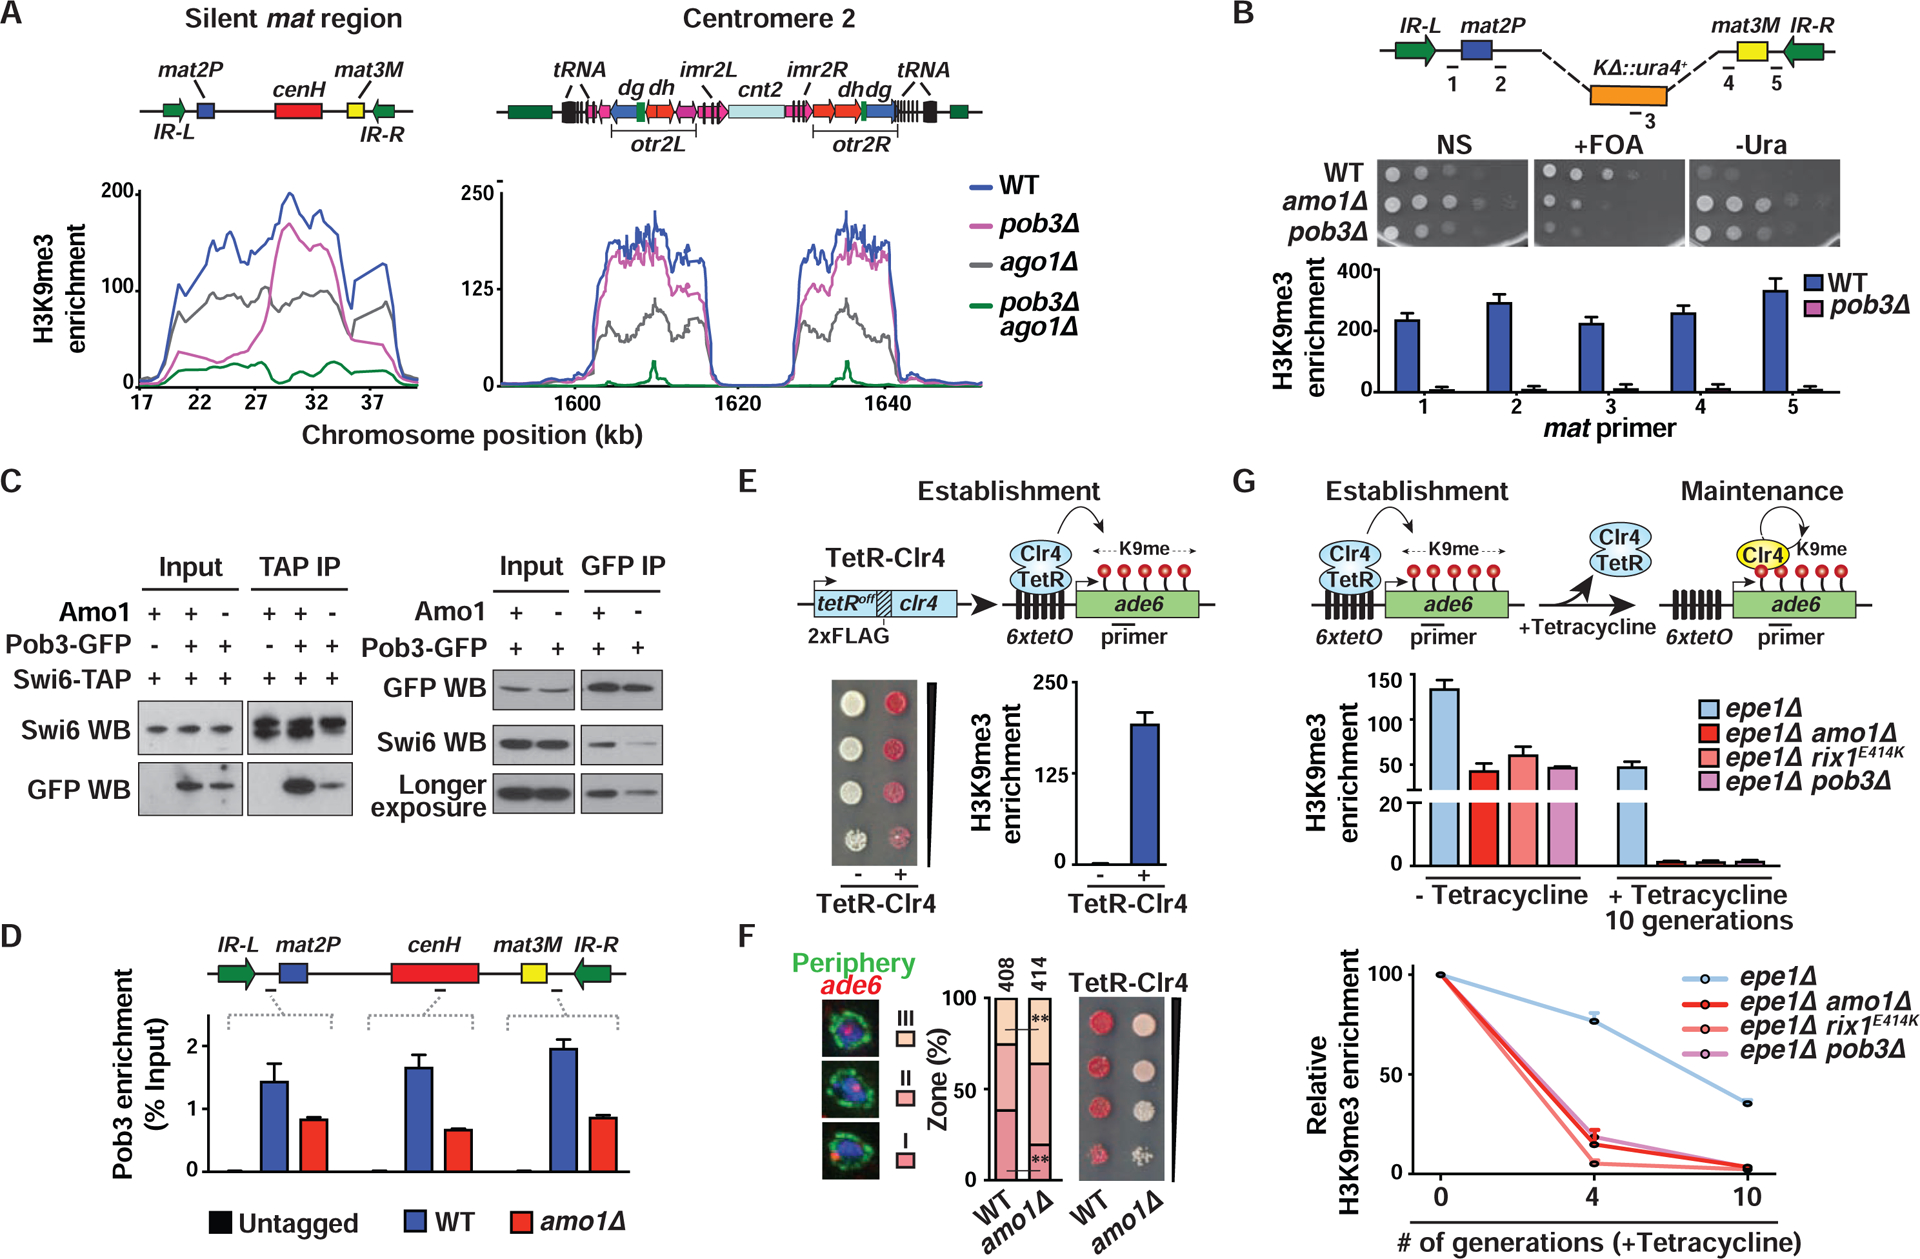
Figure 6. Propagation of endogenous and ectopic heterochromatin domains by Amo1-RIXC and FACT.

(A) H3K9me3 ChIP-chip at the heterochromatic regions. (B) Tenfold serial dilution (top) and H3K9me3 enrichments (bottom, mean ± SD, n=2) are shown for the indicated strains. (C) Co-IPs were performed using anti-GFP agarose beads (left) or anti-TAP beads (right) followed by western blotting. (D) ChIP-qPCR showing Pob3-GFP enrichments. Percent Input values of the target loci are shown as the mean ± SD (n=2). (E) Serial dilutions on low adenine EMM medium and ChIP-qPCR analysis of H3K9me3 (mean ± SD, n=2) in the indicated TetR-Clr4-expressing 6xtetO-ade6+ reporter strains. (F) Representative images of ade6+ DNA FISH in the three zones (left). ade6+ locus (%) located in each zone (“n” cells from two independent experiments) (middle). **P<0.01 as determined by Student’s t-test for ade6+ locus in zones III and I (WT vs amo1Δ). Serial dilutions of the indicated strains (right). (G) Establishment and maintenance of heterochromatin at an ectopic site. Endogenous Clr4 is indicated in yellow (top). H3K9me3 ChIP-qPCR in strains grown in EMM+tetracycline media for 0, 4, and 10 generations (mean ± SD, n=2). Fold enrichments were calculated relative to vps33 (middle) or relative to “-tetracycline” (0 generations) (bottom). See also Figure S6.
