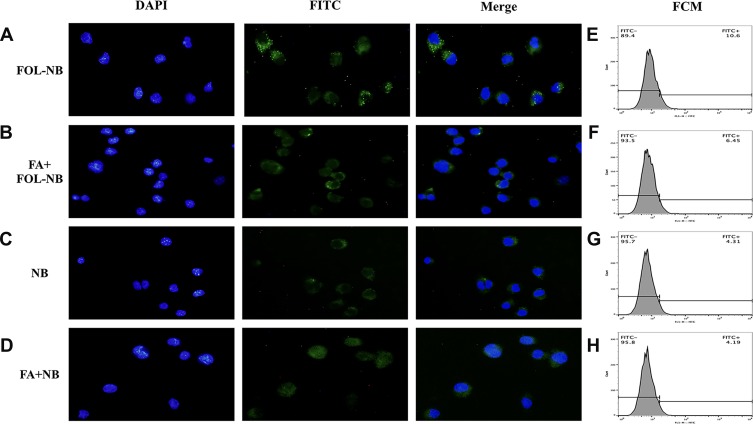
Figure 6.
Fluorescence microscope and FCM analysis of the targeted ability. Images of fluorescence microscopy displayed lots of green fluorescence dots representative of FITC-FOL-NBs being inside TAMs of FOL-NB group while the number of green dots were less in other three groups, cell nuclei labeled by DAPI stained blue. The fluorescence intensity of the FITC-FOL-NBs was stronger than FITC-NBs, indicating that FOL-NBs could specifically target FR-expression TAMs. This interaction between FA that conjugated in FOL-NBs and FR which expressed on TAMs could be inhibited by free FA (p<0.01).

