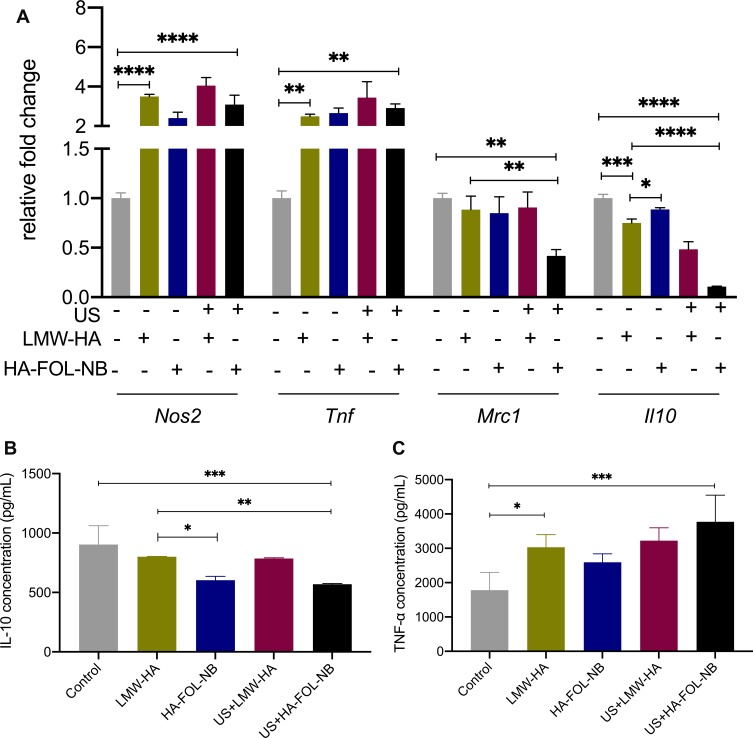
Figure 7.
Gene expressions and cytokines secretion of different treatment groups. (A) Gene expression changes after different treatment combinations on TAMs. (B)IL-10 secretion decreases after treatment with combined ultrasound and HA-FOL-NBs. (C) Concentration of TNF-α increases after treatment with LMW-HA and with combined ultrasound and HA-FOL-NBs (*p<0.05, **p<0.01, ***p<0.001, ****p<0.0001).

