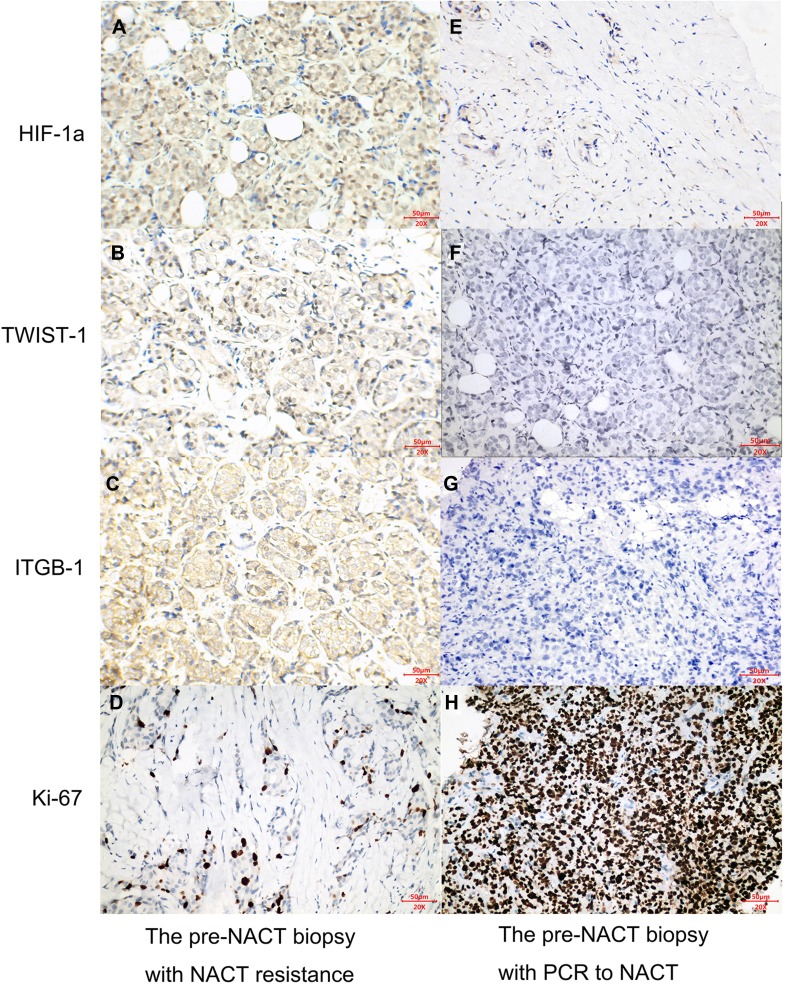
Figure 3.
Left column (A–D) Immunohistochemical analysis of a pre-NACT biopsy specimen from a patient with chemotherapy resistance. (A) High HIF-1α expression with a H score of 180; (B) high TWIST-1 expression with a H score of 160; (C) high ITGB-1 expression with a H score of 190; (D) low Ki-67 expression with a H score of 30. Right column (E–H) Immunohistochemical analysis of a pre-NACT biopsy specimen from a patient with PCR to NACT. (E) Low HIF-1α expression with a H score of 40; (F) low TWIST-1 expression with a H score of 6; (G) low ITGB-1 expression with a H score of 2; (H) High Ki-67 expression with a H score of 270.
Abbreviations: HIF-1α, hypoxia-inducible factor 1-alpha; ITGB-1, β1 integrin; NACT, neoadjuvant chemotherapy; PCR, pathological complete response; TWIST-1, twist family BHLH transcription factor 1.

