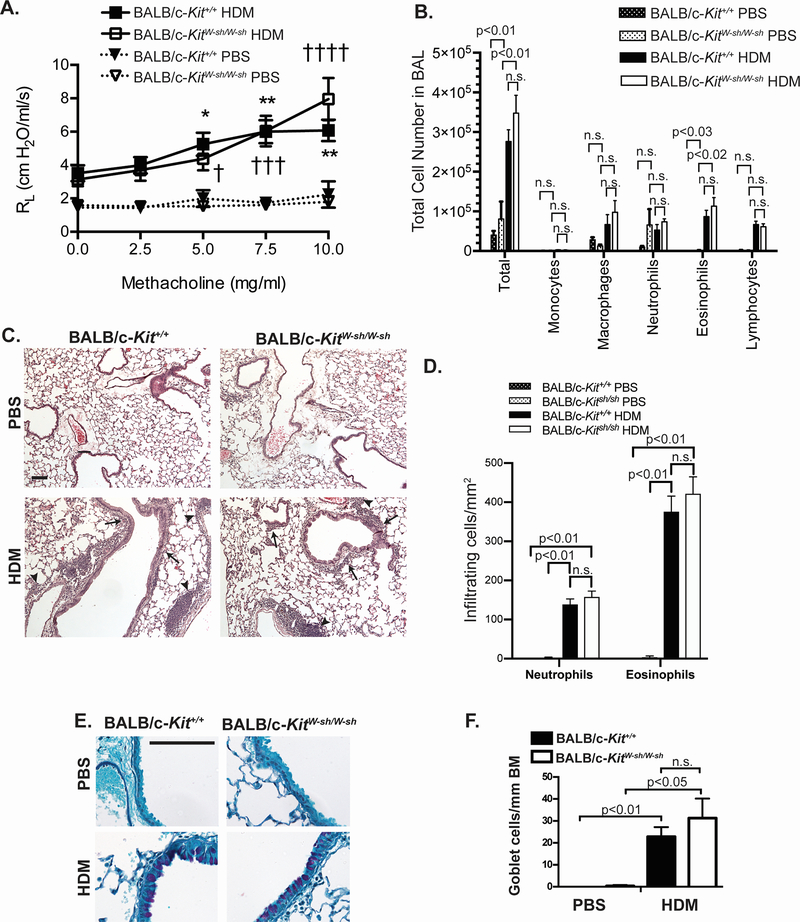
Figure 5.
Airway hyperresponsiveness to methacholine and lung inflammation develop in a house dust mite (HDM) model of chronic asthma elicited in BALB/c-KitW-sh/W-sh mice. A. Airway resistance (RL) after aerosolized methacholine and lung inflammation were measured 1 day after the ninth intranasal challenge with HDM or PBS. B. Leukocyte numbers in bronchoalveolar lavage fluid (BALF) obtained following airway measurements were determined by manual counting and by differential counts on cytospin slides. Histology in (C) H&E and (E) PAS-stained sections of lungs. In (C) solid arrowheads indicate perivascular inflammation and solid arrows indicate peribronchiolar inflammation. D. Numbers of infiltrating leukocytes quantified per mm2 of airway F. Goblet cell numbers per mm of airway basement membrane (BM) were measured in histological sections stained with PAS. Scale bars (C & E) indicate 100 μm. N=7 for BALB/c-KitW-sh/W-sh HDM, N=7 for BALB/c-Kit+/+ HDM, N=4 for BALB/c-KitW-sh/W-sh PBS, and N=3 for BALB/c-Kit+/+ PBS. Mean values ± s.e.m. (A) or + s.e.m. (B) are shown. For RL measurements, * p<0.05, **p<0.01 for BALB/c-Kit+/+ HDM vs. BALB/c-Kit+/+ PBS, † p<0.05, ††† P<0.001, †††† p<0.0001 for BALB/c-KitW-sh/W-sh HDM vs. BALB/c-KitW-sh/W-sh PBS, as determined by 2-way ANOVA. For BALF cell counts and infiltrating leukocytes counts on histology, p values for t tests comparing BALB/c-Kit+/+ PBS vs. BALB/c-Kit+/+ HDM, BALB/c-KitW-sh/W-sh PBS vs. BALB/c-KitW-sh/W-sh HDM, and BALB/c-Kit+/+ OVA vs. BALB/c-KitW-sh/W-sh HDM that remained significant after correction for performing multiple t tests are shown (see Methods). For goblet cells counts, group means were compared by ANOVA.

